A Real cfRNA Workflow, Step by Step
Follow a researcher from cohort inspection to QC, differential analysis, figure questions and a reviewed report. The screenshots show a real browser workflow with the OpenAI API and GSE174302 measurements. The answers were generated in the workflow, and the figures were produced by the local scientific tools. Click any full-workspace screenshot to inspect its original 1680 × 1100 image.
What you need
- Start the browser workspace with
liquid-agent(liquid-agent webalso works). Useliquid-agent clifor the terminal, orliquid-agent wikifor the public homepage and Docs. - Configure an OpenAI key through the model menu → Manage keys. Current runs use
gpt-6-lunathroughauto; older screenshots may show the model available when they were captured. No key appears in the screenshots. See key storage and model selection. - Keep your data disk mounted. This example uses a separate working directory so existing tasks remain unchanged.
The input is a prepared subset of a public study, not all of GEO accession GSE174302: 54 colorectal-cancer and 19 healthy samples from one recruitment centre, with all mRNA-annotated rows retained. all.csv has 19,813 features; intron.csv has 18,952; both have the same 73 samples. metadata.csv, two .assay.json manifests and provenance.json record the labels, count definitions and source hashes.
This example uses a cohort prepared from published metadata before opening the interface. Choosing a folder does not automatically perform that cohort curation. Use the assay-table contracts to prepare your own inputs; see the study and preparation record. Do not infer case/control labels from filenames alone.
1. Choose data and check the cohort
Click New chat → Choose folder, or the folder icon in Sources. Navigate into the prepared GSE174302 folder and choose Open. The browser lists directories, so “No subfolders” does not mean that the selected directory has no data files.
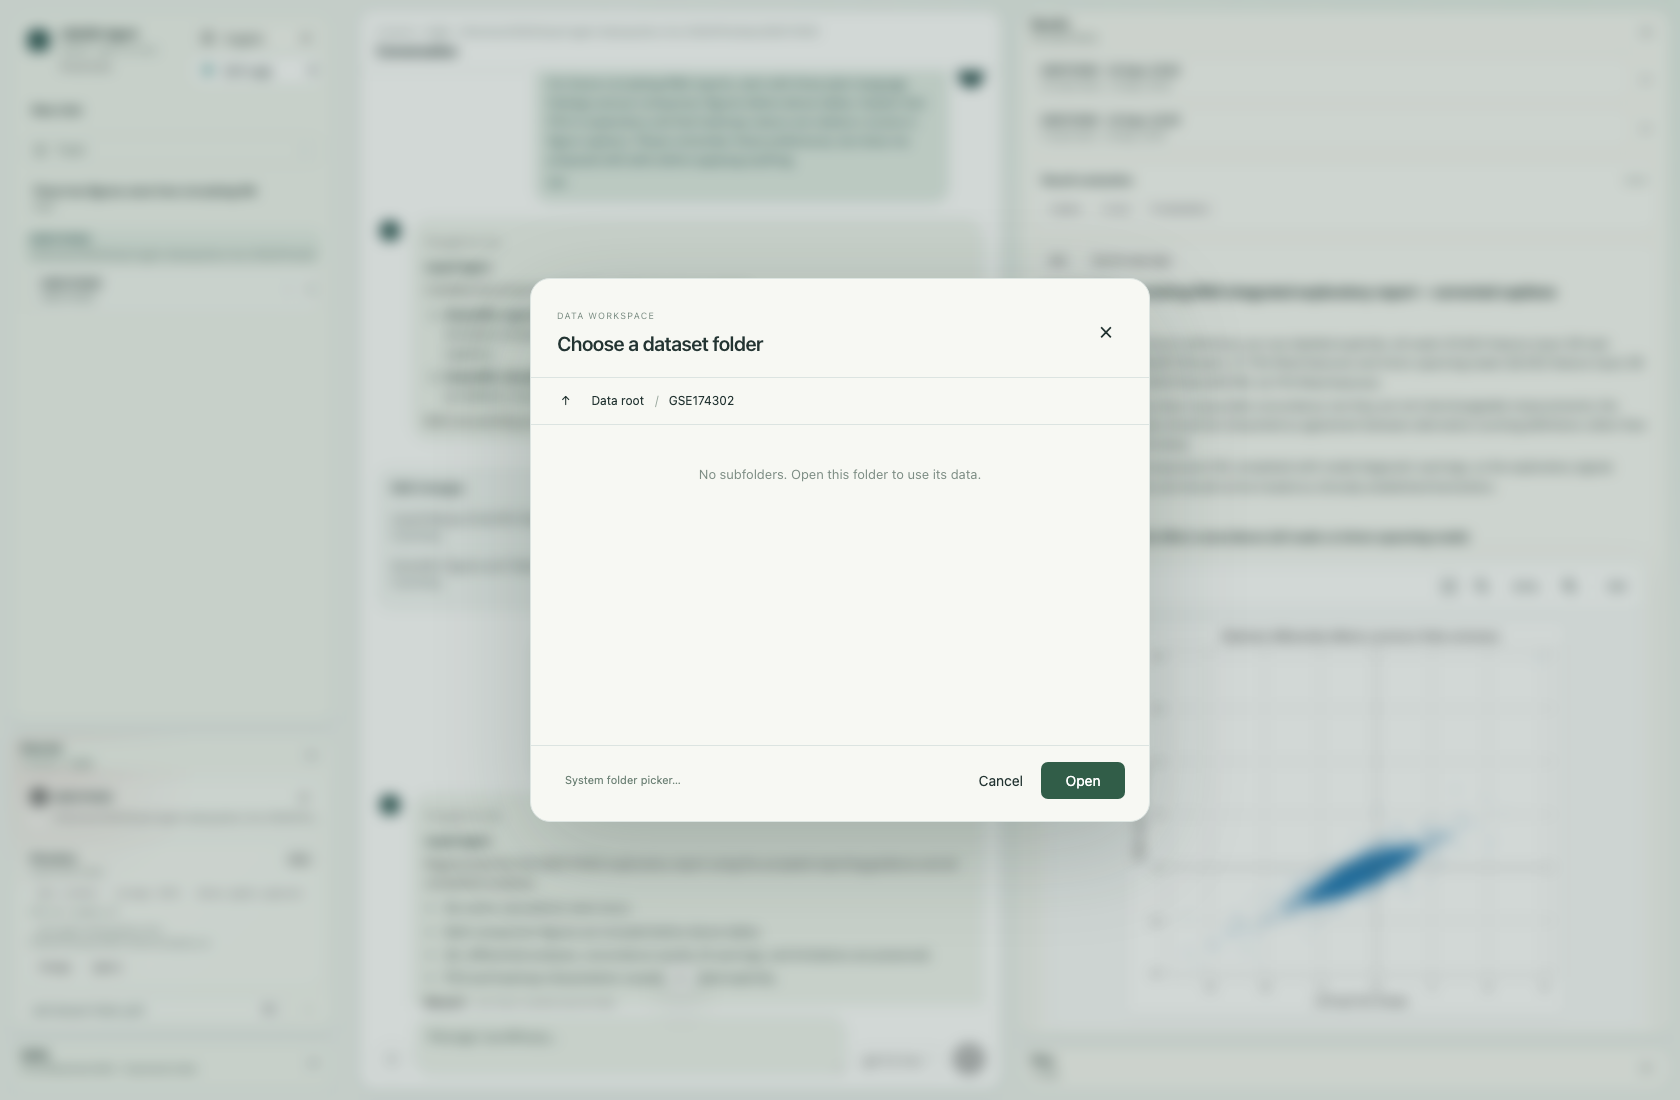
Choose the dataset directory with the folder picker, then Open. Wait for Source scanned. Check Sources before asking for a comparison: this run shows CRC: 54 · healthy: 19, complete label coverage and one attached source. “Supervised-ready” is a technical metadata indicator, not a clinical-validity assessment.
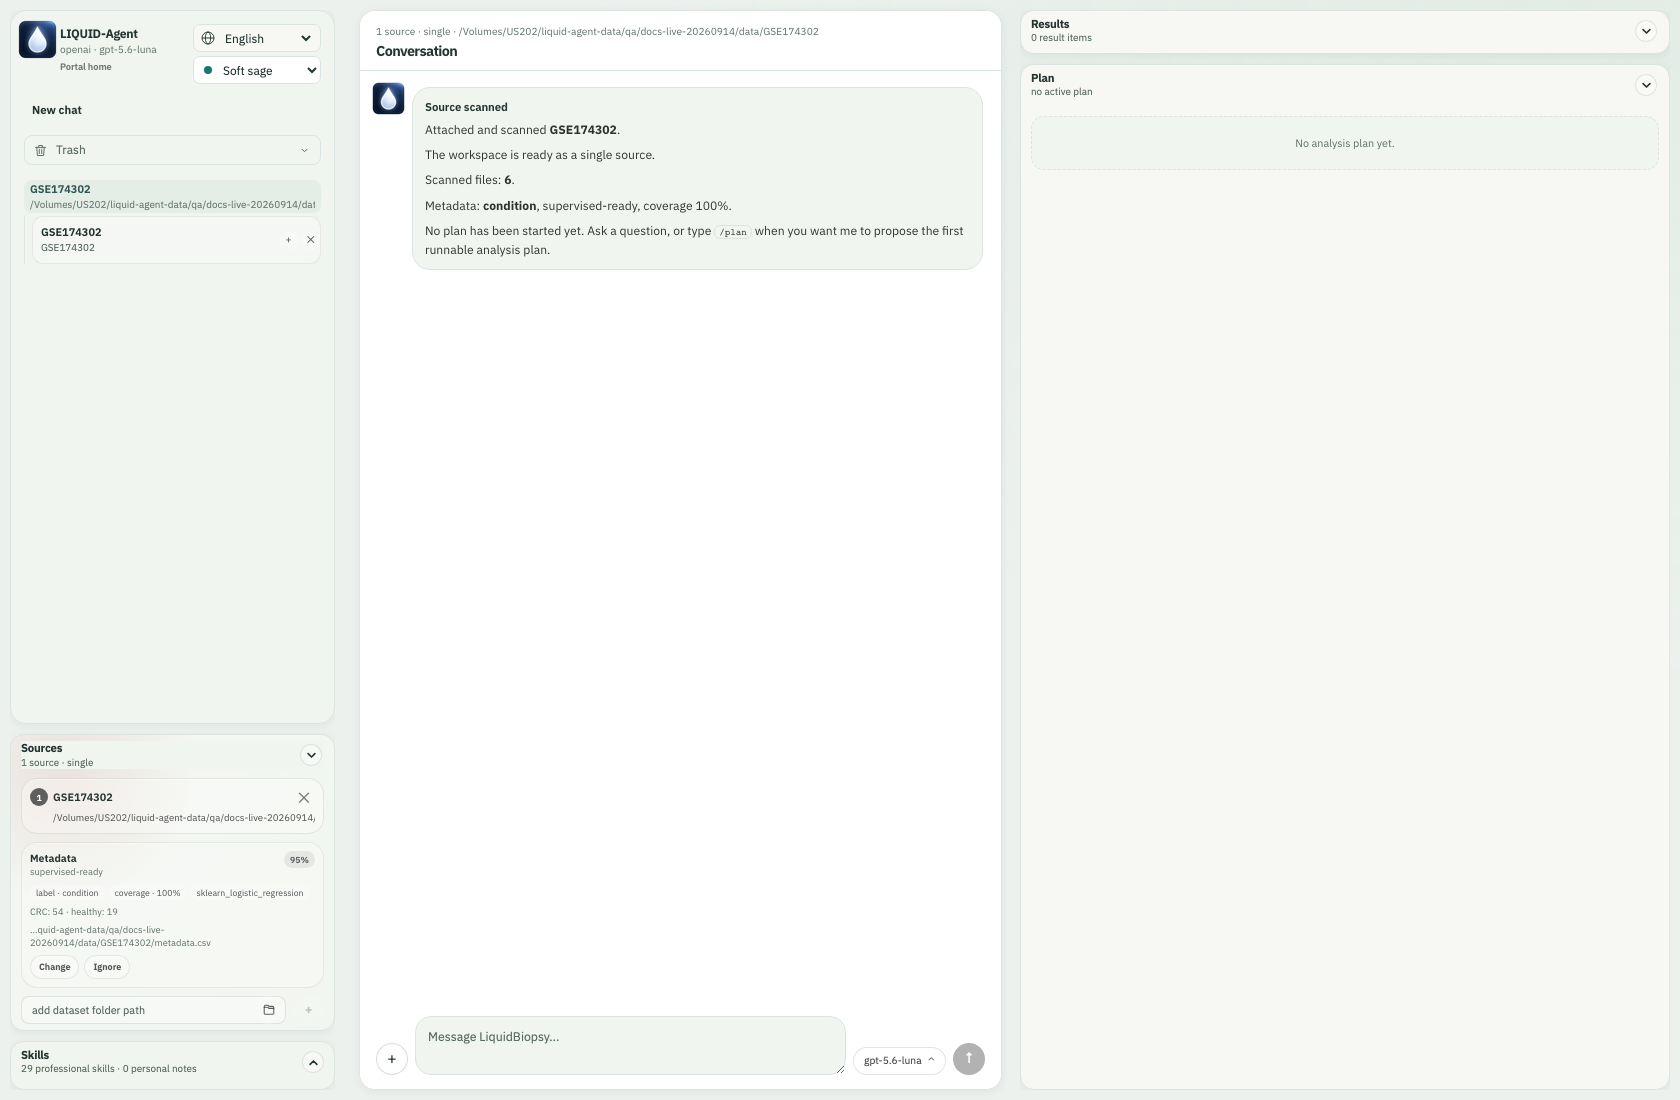
The scan identifies six prepared input files and the 73-sample metadata; no analysis has run yet.
2. Discuss the study before running it
We entered this question:
I am studying circulating RNA in colorectal cancer. Inspect the attached GSE174302 cohort and its two count matrices. Explain the sample groups and measurement differences, then propose a staged plan: QC each matrix, compare CRC with healthy samples, compare the two sets of results, and write an exploratory report. Use appropriate skills. Do not run the analyses yet.
The agent inspected the workspace, loaded relevant guidance and published a four-step runnable plan: two QC tasks and two differential-expression tasks. Cross-matrix comparisons were deferred until their prerequisites existed. A plan is not an executed result.
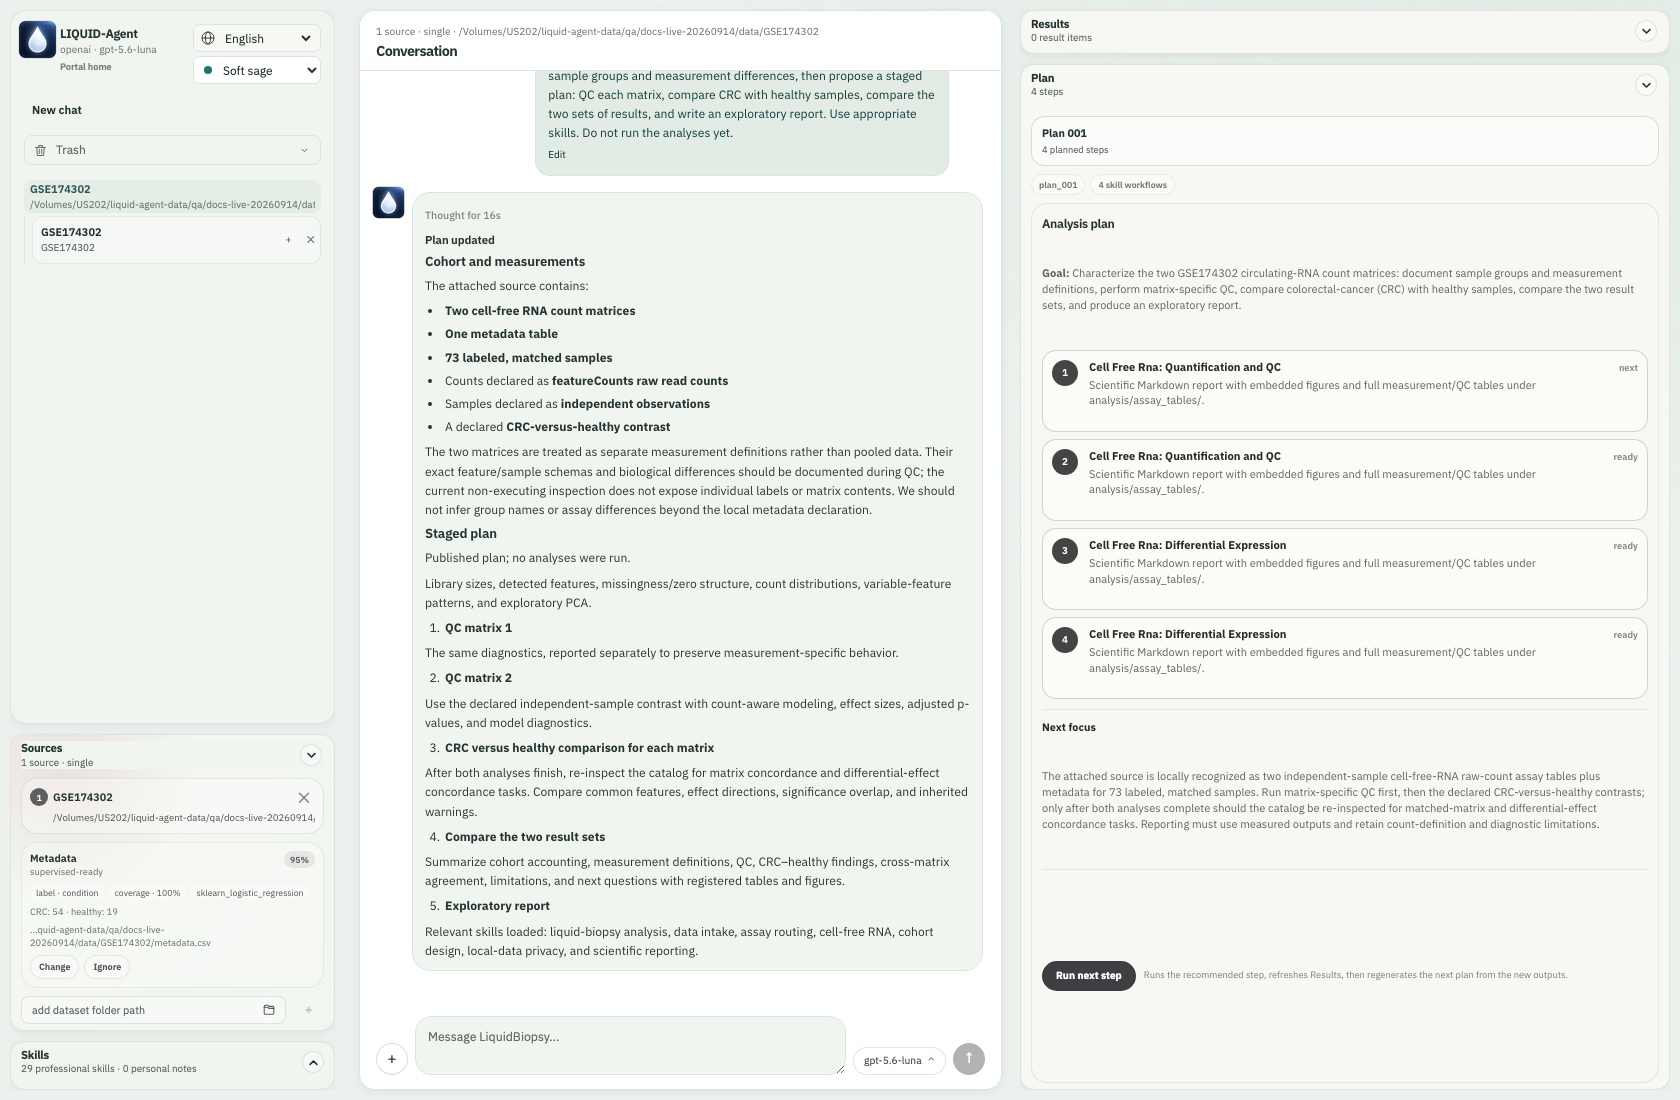
Review the proposed tasks in Plan before using Run next step. You can open Skills → Cohort Design and Statistical Validation to read the guidance yourself. Selecting a skill opens its text; it does not execute an analysis or force every future message to use that skill. The agent can choose no skill, one skill or several as relevant.
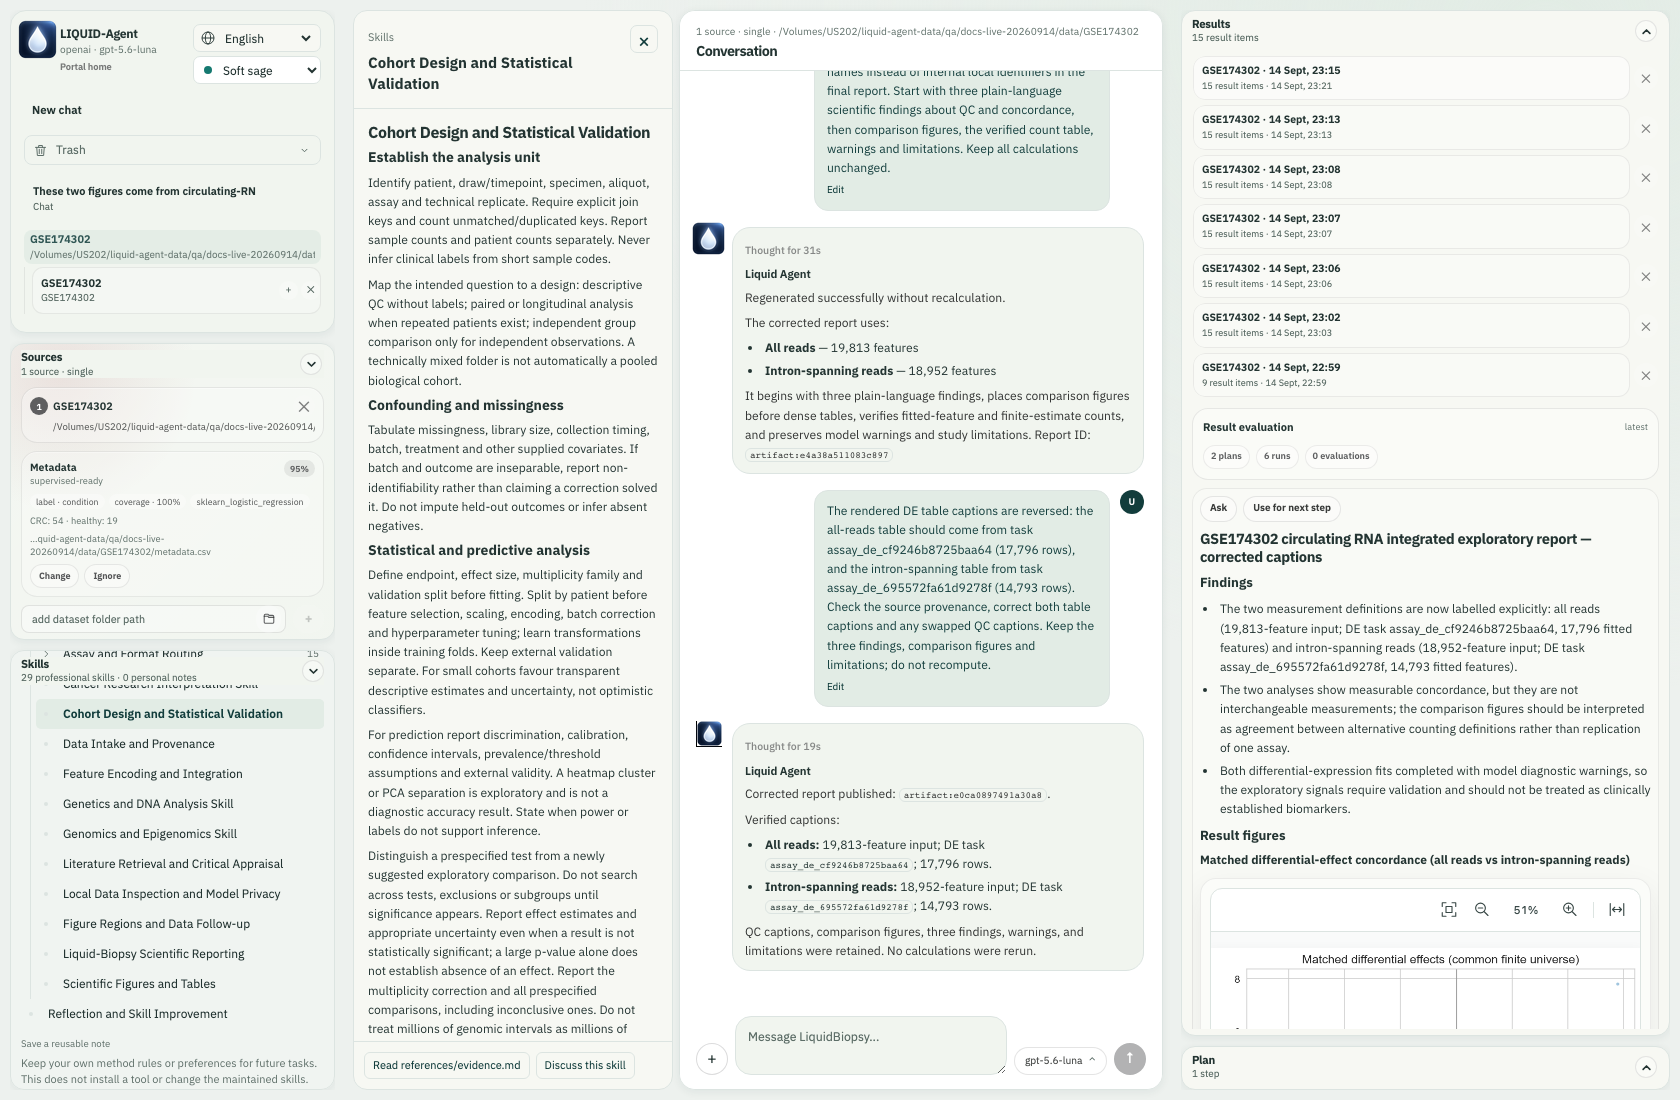
Read the cohort-design guidance, including confounding, analysis units and exploratory interpretation.
3. Run one step, then decide what comes next
Click Run next step in Plan. In this run the button submitted a scoped instruction to execute only the first matrix's QC, inspect its output and propose a next plan. The first matrix produced 73 samples × 19,813 features, zero missing entries, a mean library size of approximately 3.64 million counts, tables, a PCA plot and a feature heatmap. The second QC and both differential analyses had not run.
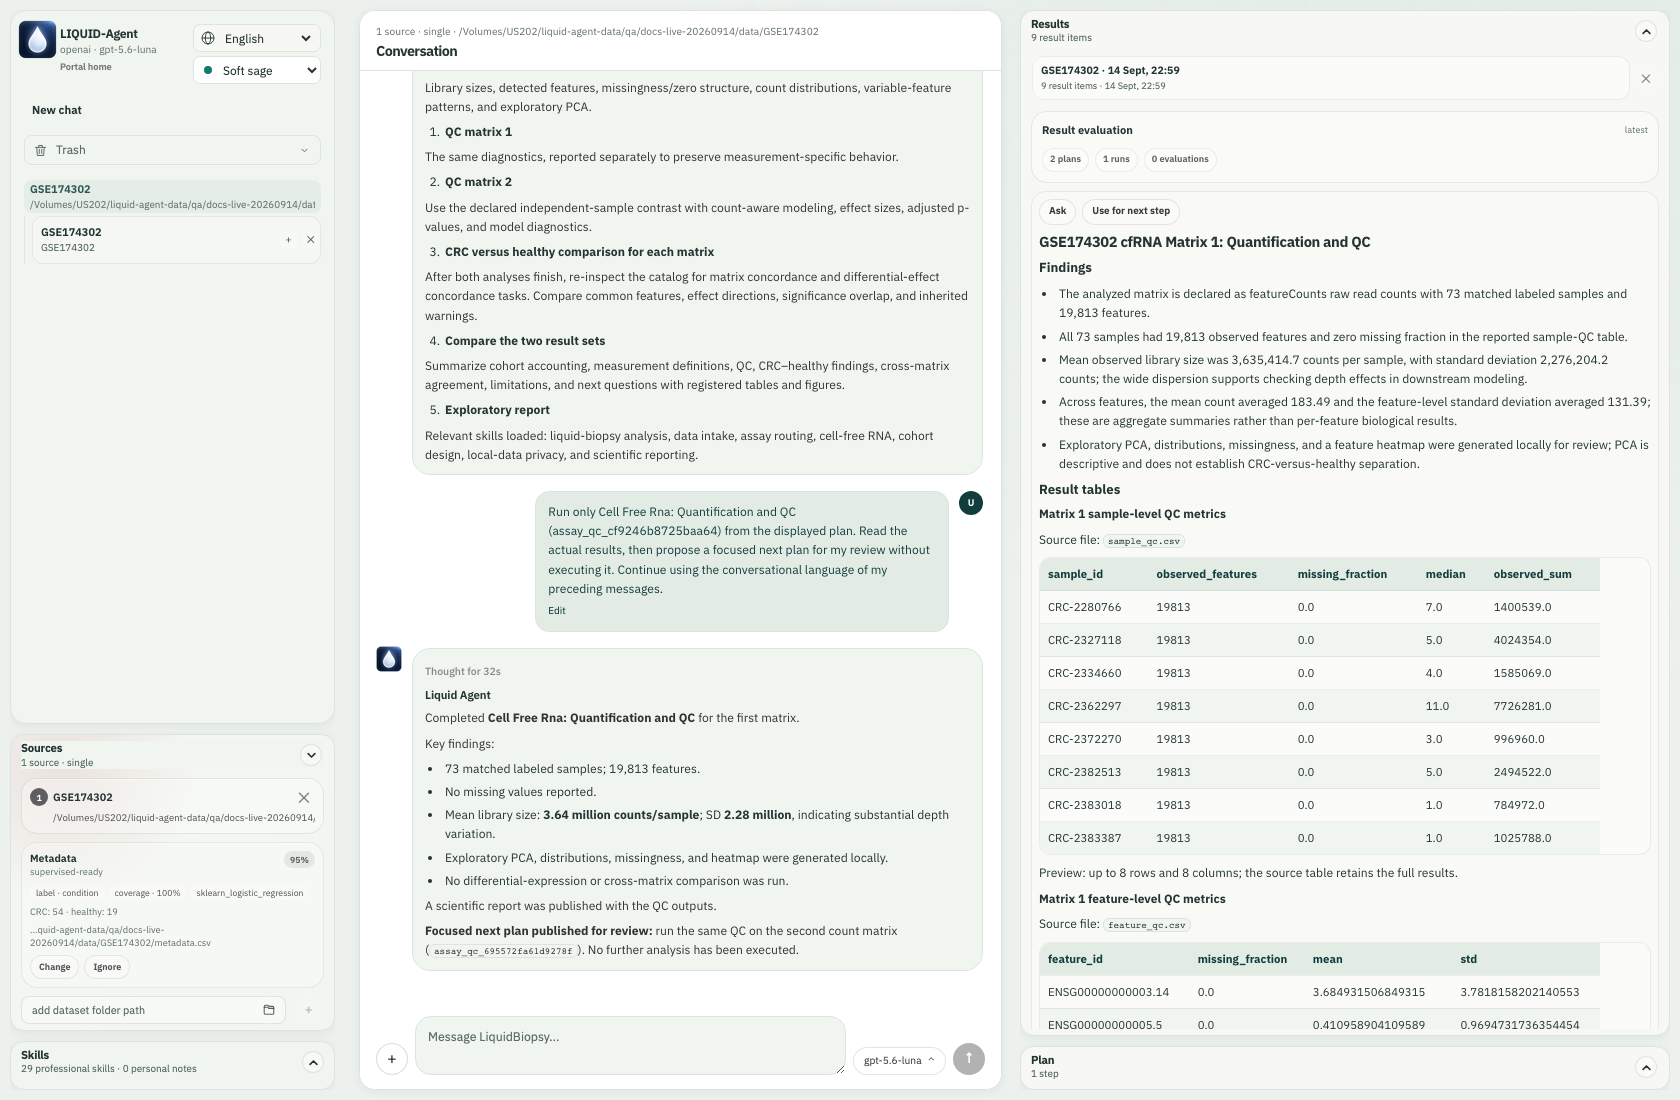
The first completed QC result appears alongside the answer; the remaining work is still separate. Results has two different follow-up buttons:
| Button | What happened in this live example |
|---|---|
| Ask | Sent “Review result: Integrated analysis report”; later returned a numerical interpretation and caveats for the selected comparison report. |
| Use for next step | Sent “Use result for next step: Integrated analysis report”; returned a focused follow-up recommendation. It did not start another analysis. |
| Run next step (Plan) | Actually executed the recommended task. Review its scope first. |
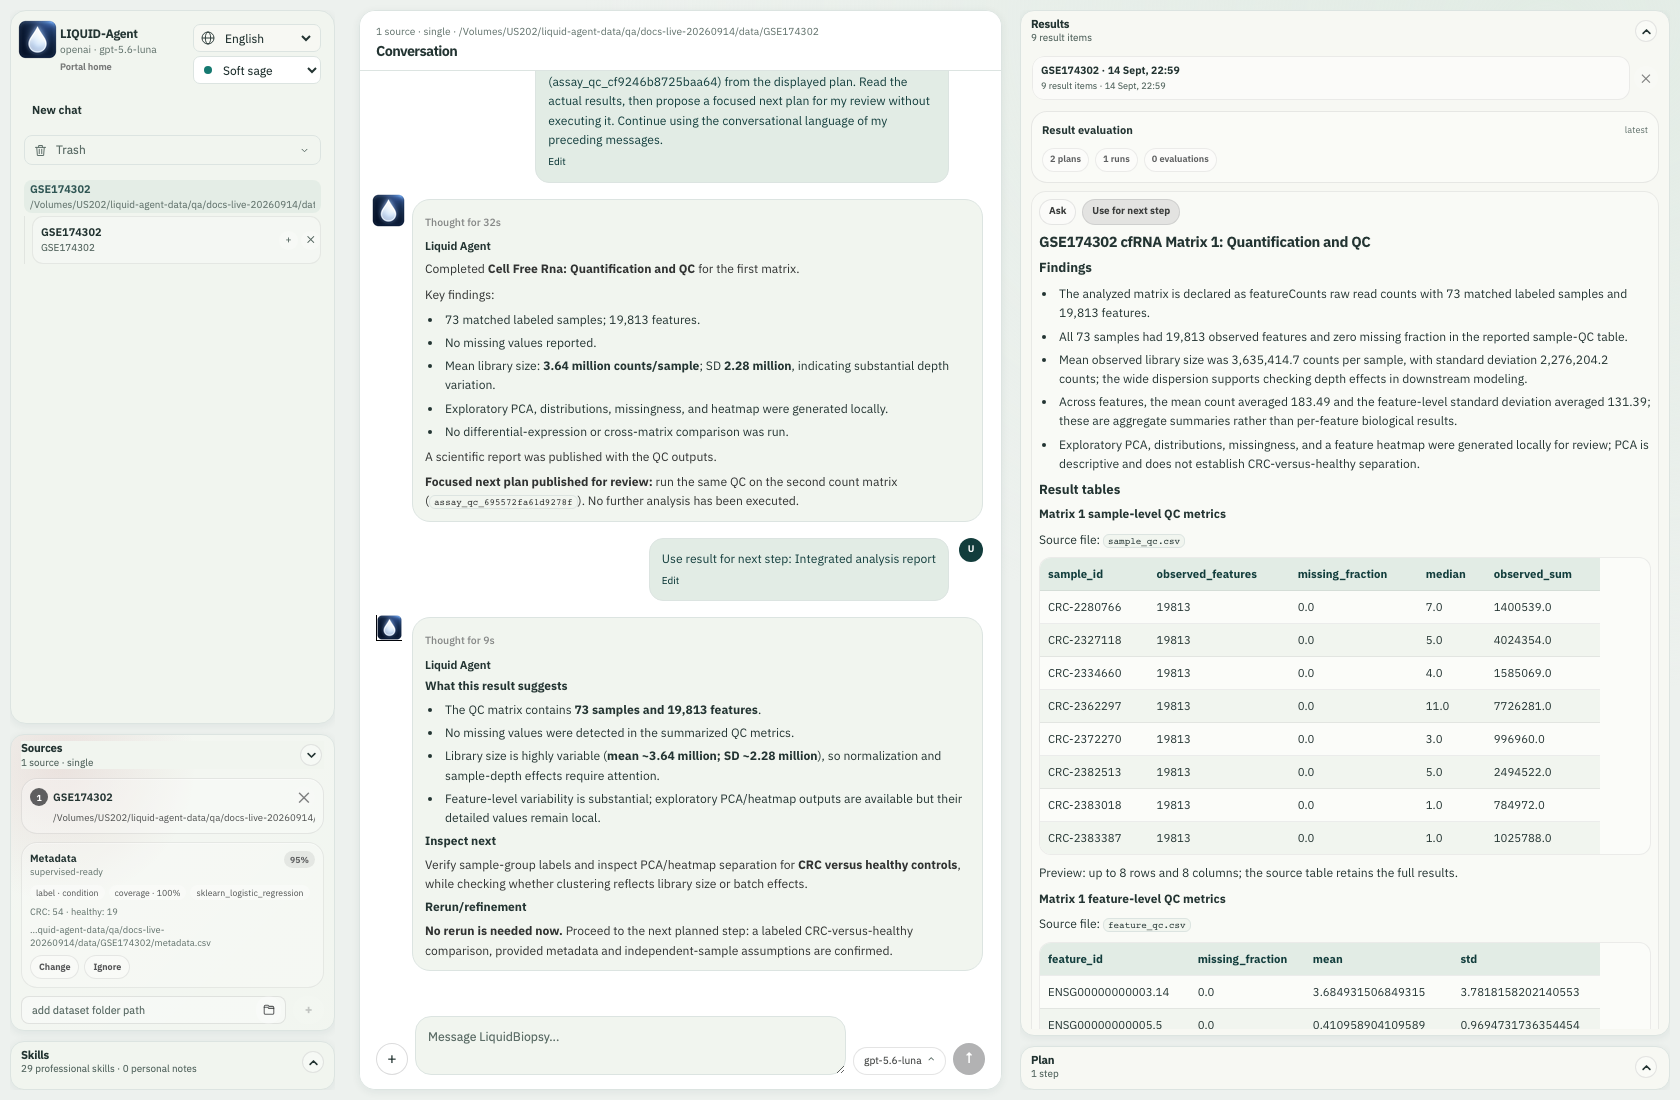
Use for next step discusses what to inspect or run next; this click added no scientific job.
4. Authorize the longer workflow
After reviewing QC and the next-step advice, we entered:
Proceed with QC of the second matrix and the CRC-versus-healthy differential analysis of each matrix. Then inspect the available comparison tasks and run matched-expression and differential-effect concordance. Keep the two measurement definitions separate, preserve model warnings, and publish an exploratory report. Reuse completed QC; do not rerun it.
The agent completed the remaining work with six scientific runs in total: two QC, two PyDESeq2 contrasts, expression concordance and differential-effect concordance. Later image questions and report revisions did not repeat these six runs.
During execution, the task's circle spins and its attached Sources are outlined. The conversation displays current operations and worker liveness, rather than leaving an unexplained blank wait. We refreshed during the live task and reconnected without resubmitting it.
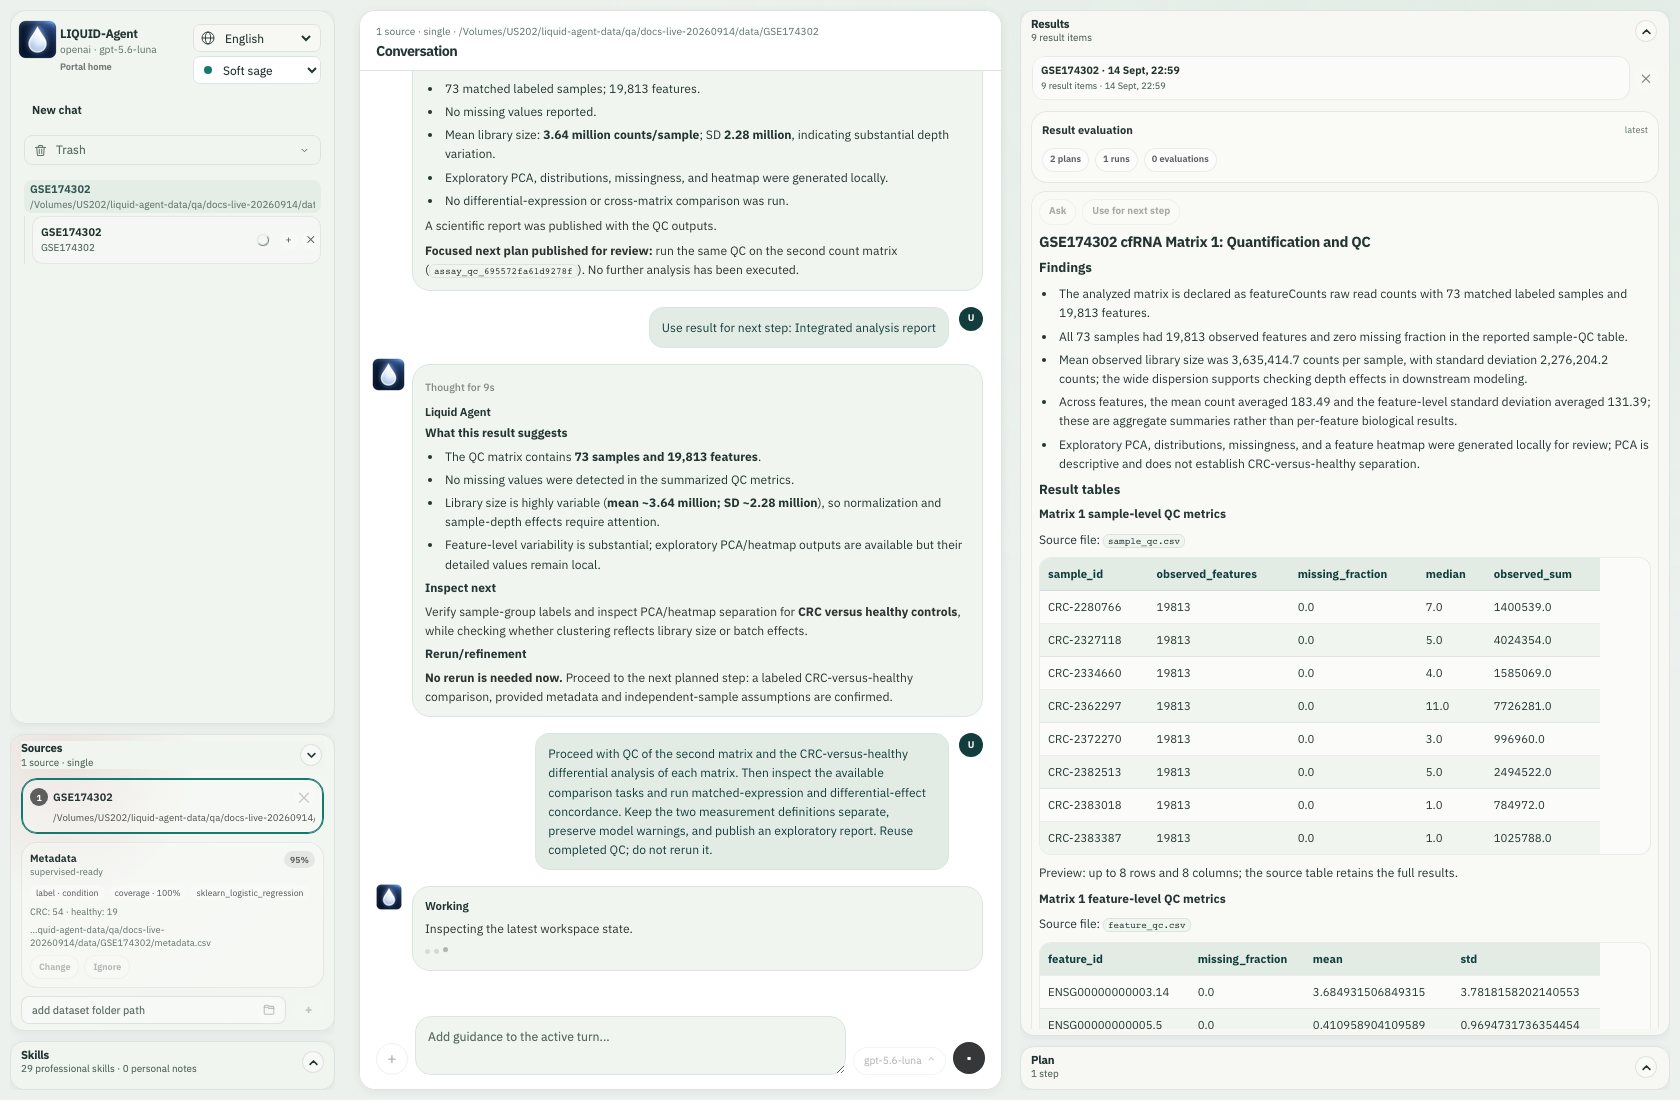
The live turn displays its current operation, a spinning task indicator and the highlighted source. These are execution updates, not private reasoning. The main task also completed while we were in the separate image-question conversation below. Its spinner became a blue Task finished · unread dot; opening the task cleared it. A blue dot means there is a terminal update to read, not that every task necessarily succeeded.
5. Ask about a region inside a result
Open the first QC entry in Results history and scroll to its PCA figure. Use Select region to ask, then drag across the right-hand points. Six mapped marks were selected in this example. Enter a question in the small field beside the selection and press Enter:
Inspect these PCA outliers in the source data. Are they technical or biological? Do not exclude samples.
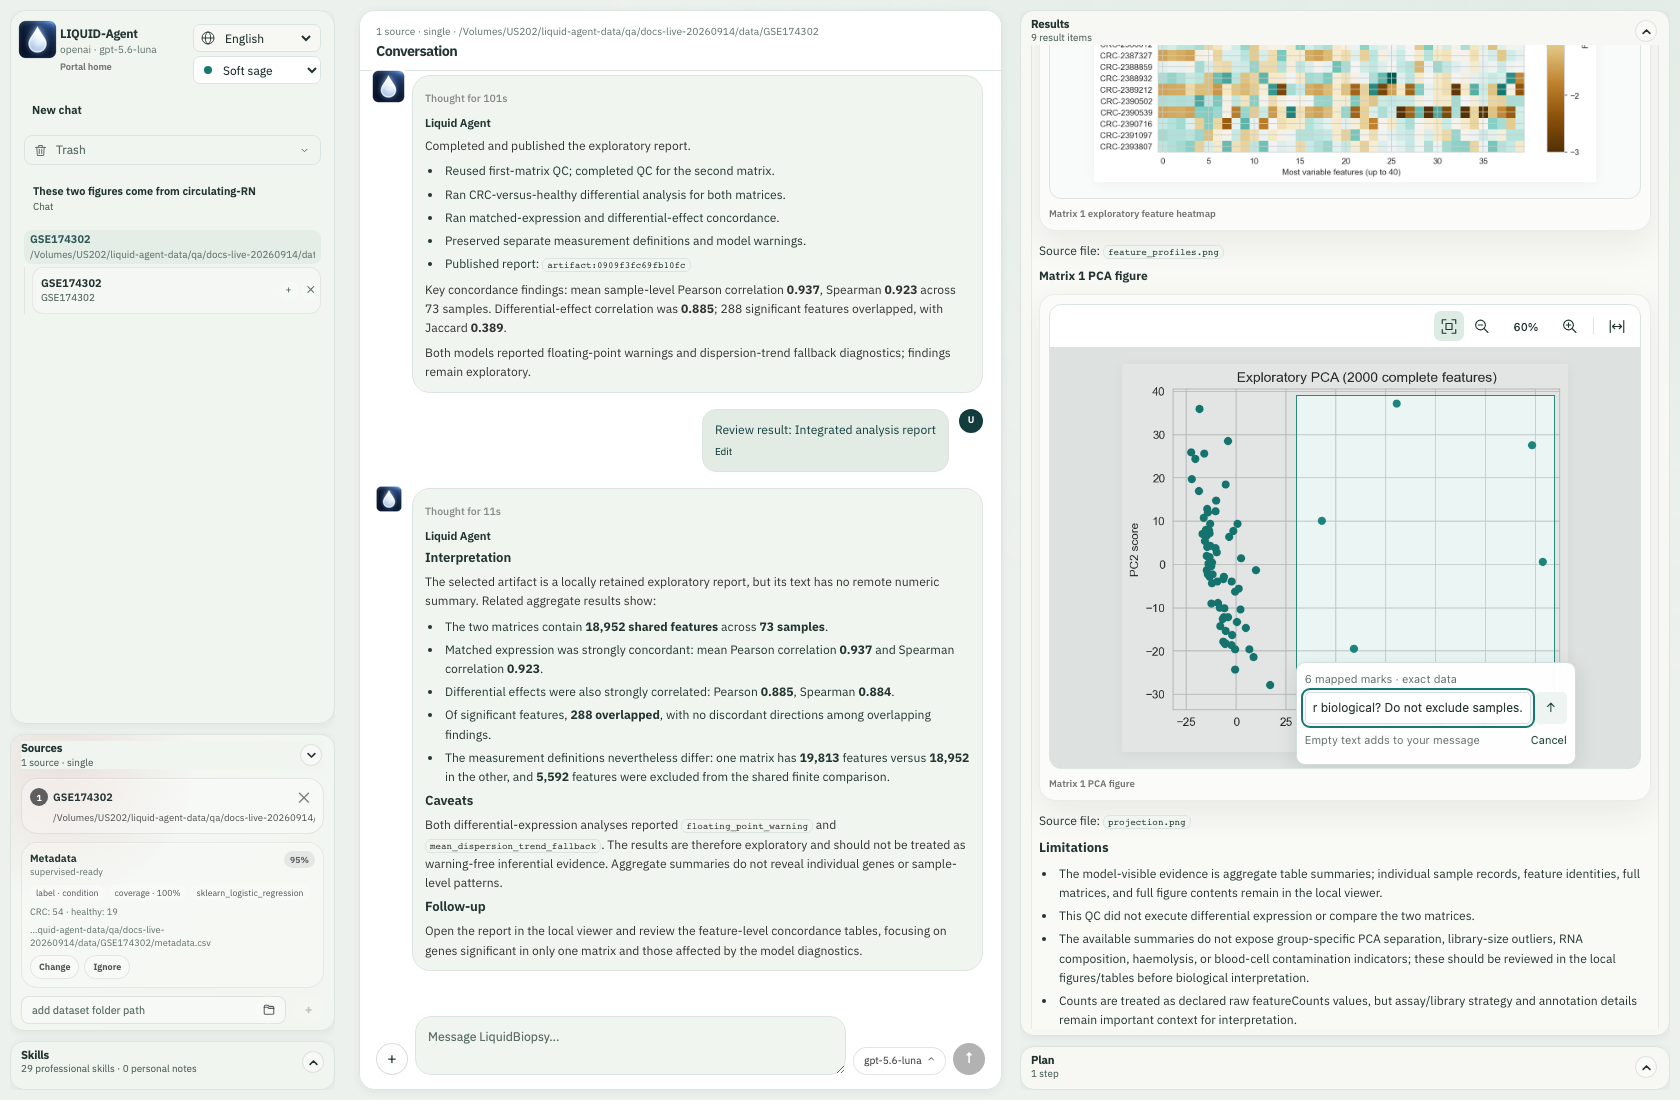
The PCA selection contains six exact mapped sample marks; the adjacent input submits the crop with its question. The crop appeared in the user message. The agent inspected 118,878 finite source measurements across 19,813 features for the six samples, then explained why their technical/biological cause remained unresolved. It did not remove samples. An exact mapping supplies a data link; it does not automatically supply every clinical or batch covariate.
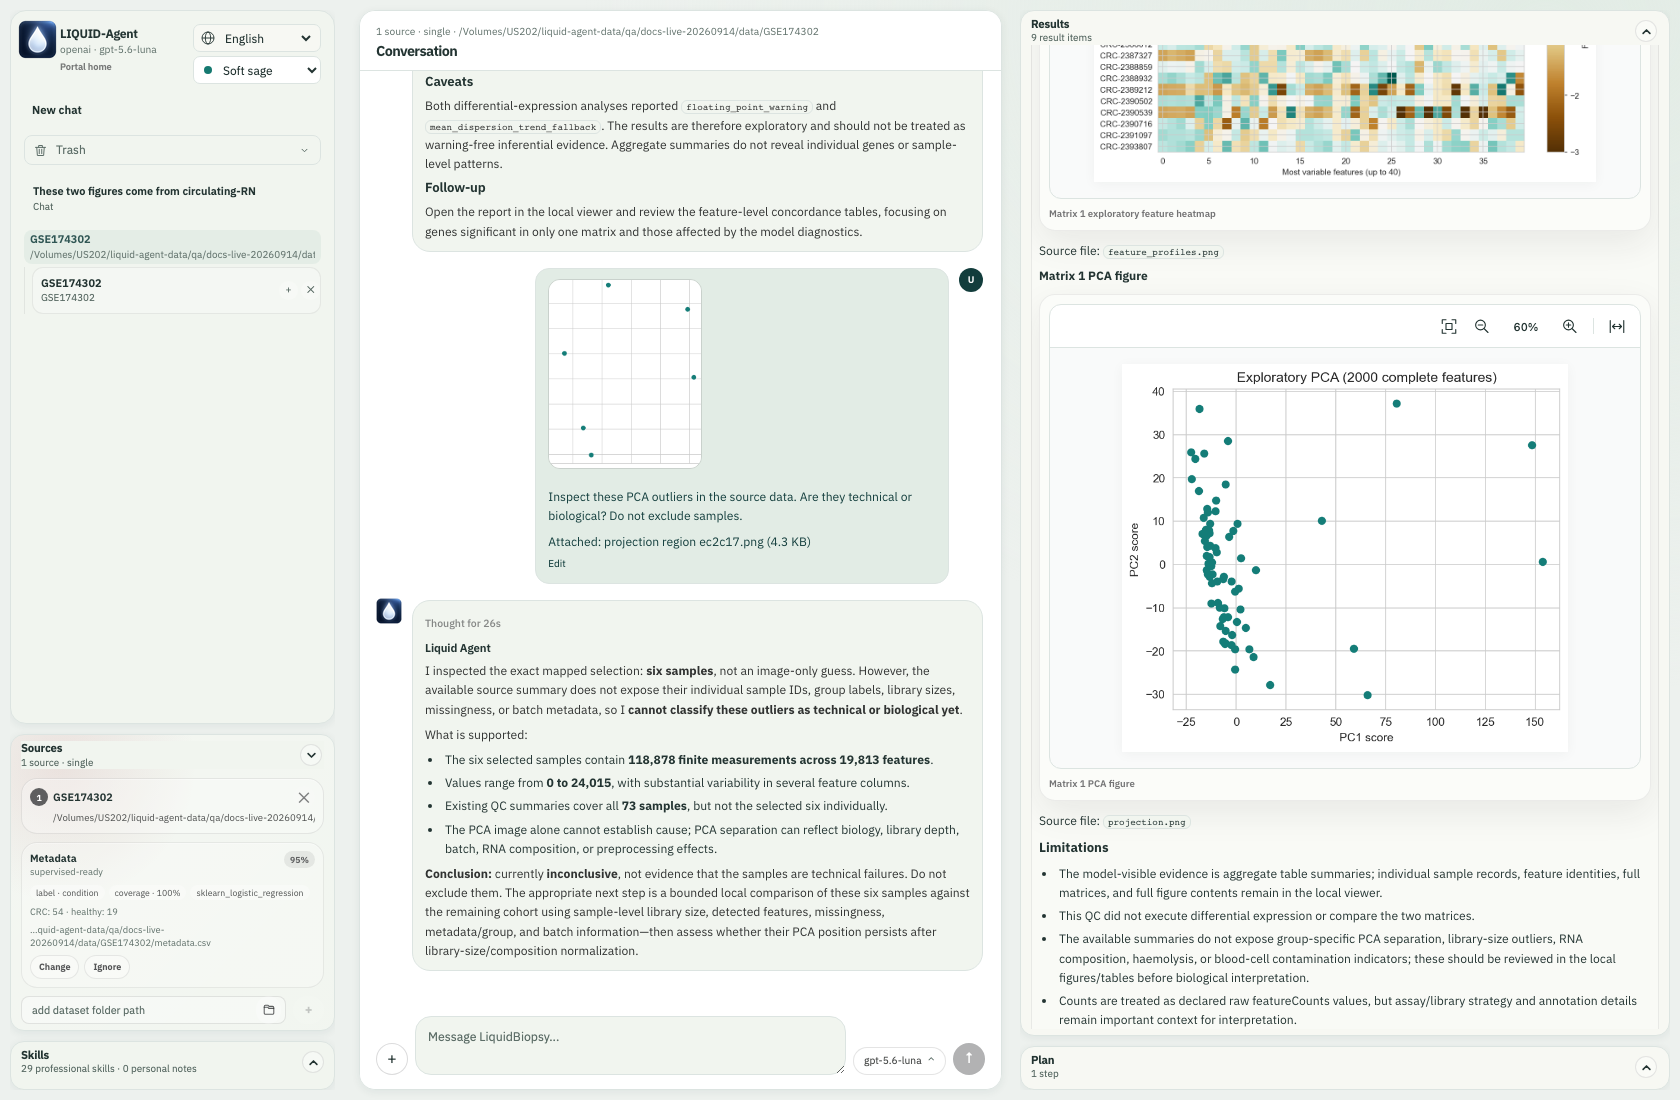
The real answer uses the mapped data and states the limits of the PCA interpretation.
6. Combine crops from two different figures
This is a different interaction from immediate single-region submission:
- Select the PCA region again. Leave the small question field empty and click its +. The main composer now shows one image and the 1/4 guidance.
- Scroll to the feature heatmap, use Fit to width to inspect it, and select a block. This run mapped 165 cells, spanning 11 rows and 15 columns.
- Leave that field empty and click + too. There are now two different figures in the composer.
- Enter one joint question and submit:
Compare the PCA outlier region with this heatmap block. Inspect both mappings; explain their units and whether they identify the same samples. Summarize the selected data separately and write a short follow-up report. Do not merge selections or rerun differential analysis.
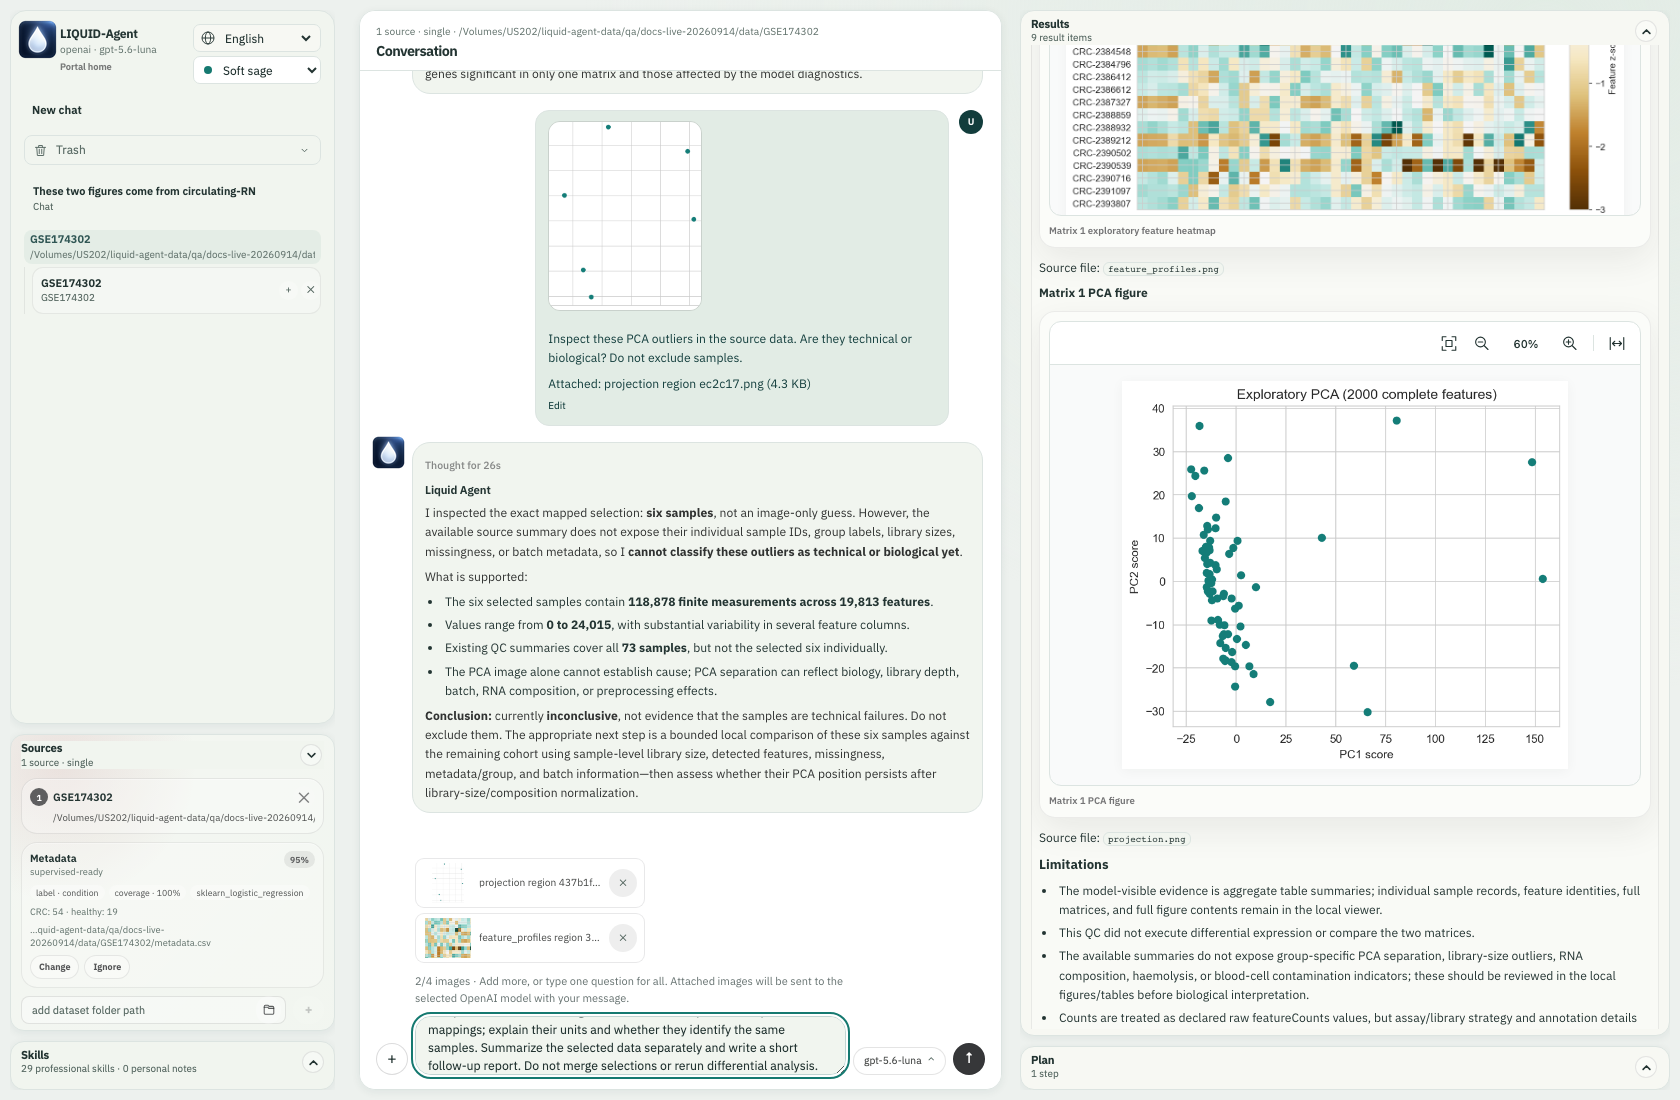
The composer holds a PCA crop and a heatmap crop, with the 2/4 reminder and a shared question.
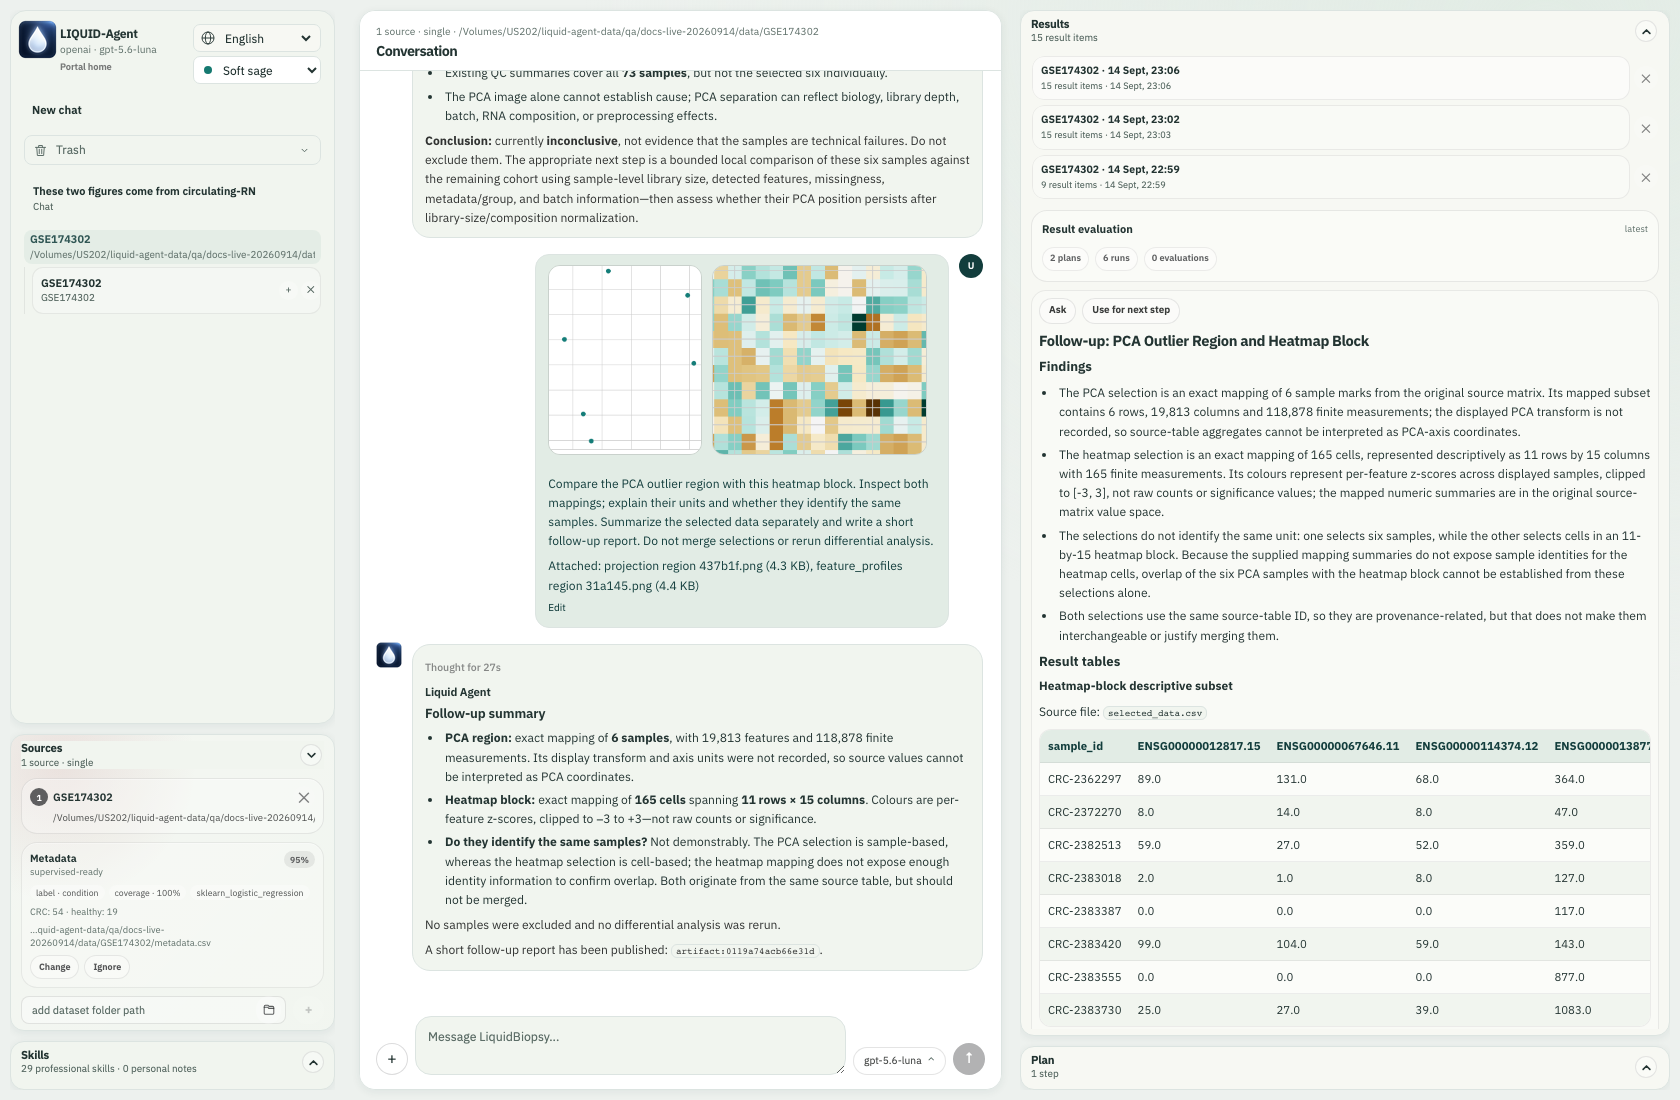
Both crops remain in the sent message; Results displays the newly generated selected-data table and follow-up report. The answer distinguished sample marks from heatmap cells, and raw counts from per-feature z-scores. The available aggregate mappings did not establish that the two selections represented the same individuals. The agent reported that limitation, preserved separate selections and did not rerun differential expression. Read the illustrated figure-input guide for the intermediate selection and upload screens.
7. Teach a reusable preference and review the changes
We then asked:
For future circulating-RNA reports, start with three plain-language findings and put comparison figures before dense tables. Explain that PCA is exploratory and that heatmap colours are relative z-scores in figure captions. Please remember these preferences, but show me proposed skill edits before applying anything.
The real API turn drafted changes to Liquid-Biopsy Scientific Reporting and Scientific Figures and Tables. Neither was initially applied. Click a name in the compact Skill changes card to inspect the red deletions and green additions.
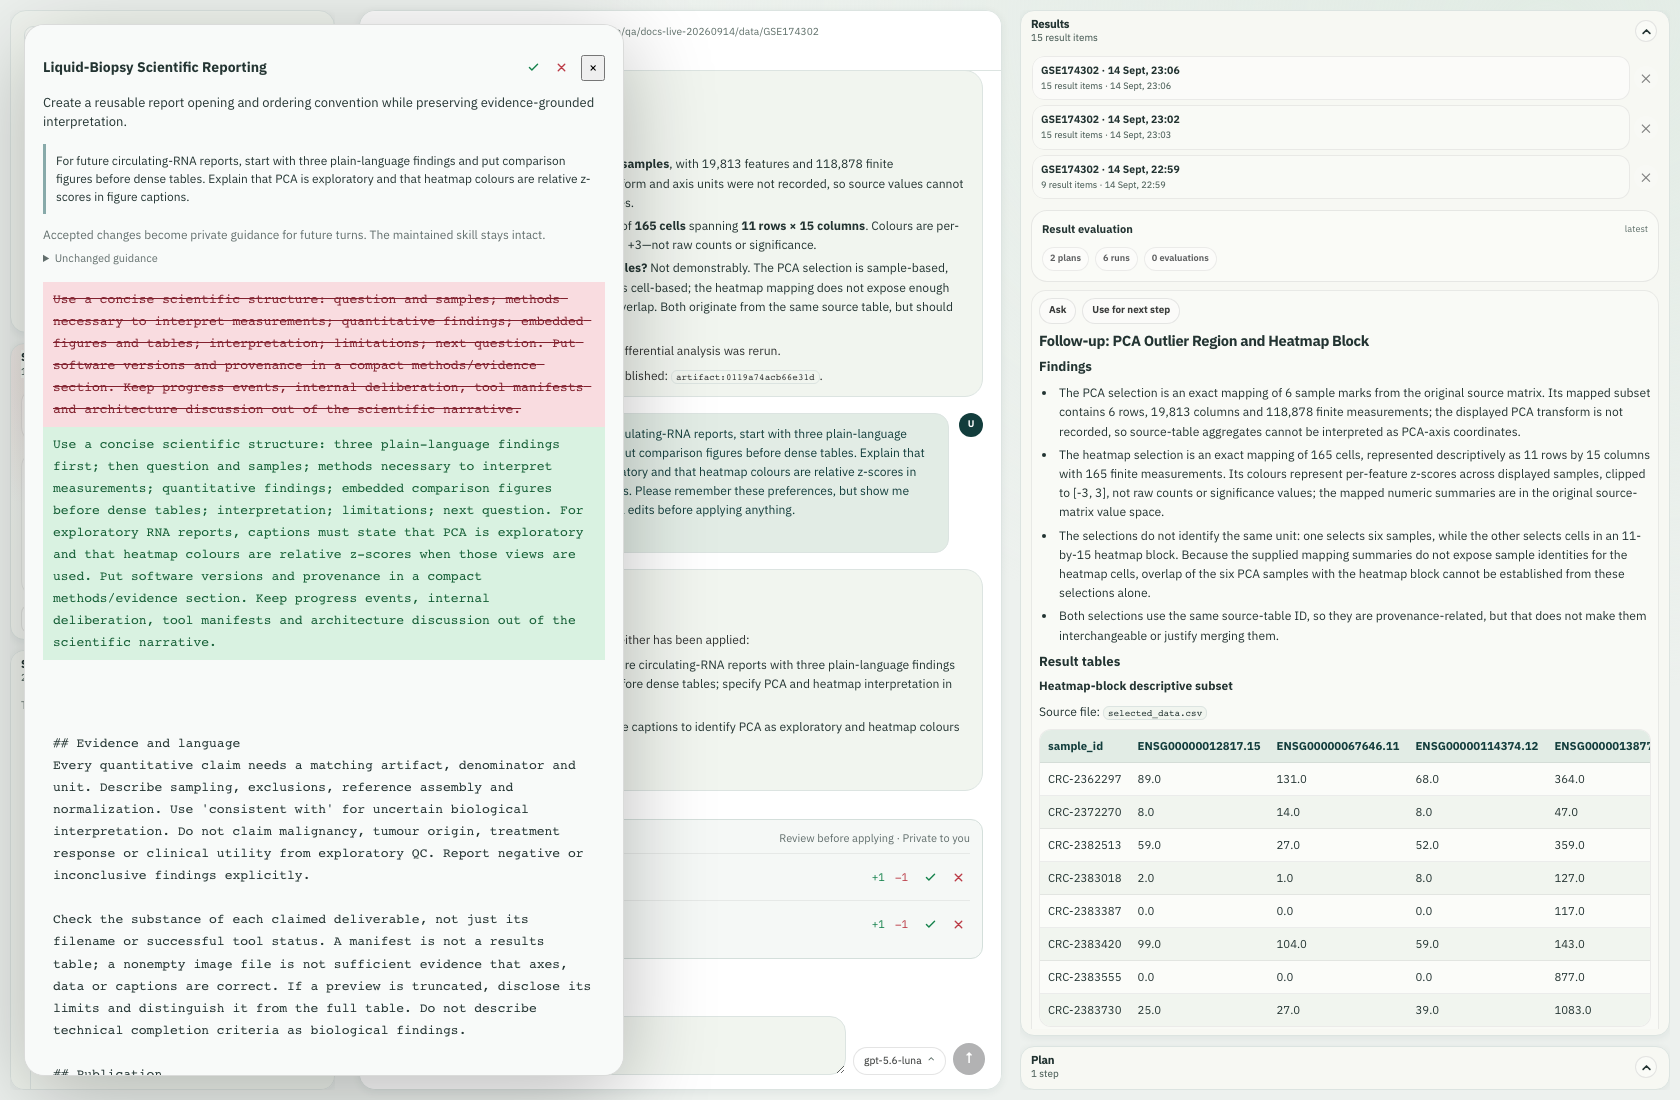
Review the actual proposed reporting change before accepting it. For this example we accepted the reporting hunk and rejected the separate figure-skill draft using the small controls at the right of its Skills row. These were actual review actions in the isolated skill library. You may make a different choice; a proposed edit is not an obligation.
The card stays with its originating conversation turn. A later message scrolls it into history; pending actions can still be found at the right end of the relevant Skills row. See the skill-review screenshots for both locations.
8. Revise the report without recomputing the matrices
We requested a full report using the accepted guidance, both comparison figures, completed analyses and model warnings, explicitly saying “Do not repeat matrix calculations.” We also asked the agent to check the assignment of counts to all.csv and intron.csv, rather than relying on ambiguous “matrix 1/2” order. Review caught swapped DE captions; a general request to check them was insufficient. We supplied the verified task-to-definition correspondence and checked the corrected rendered tables against the source outputs. This was a report correction, not proof that the application now prevents every caption error.
Review the report in Results: read the findings, scroll through the figures, inspect the tables and finish at limitations and next questions. The figure toolbar supports zoom and width fit; wide tables scroll within their panel. Opening an earlier Results-history entry does not rerun the study.
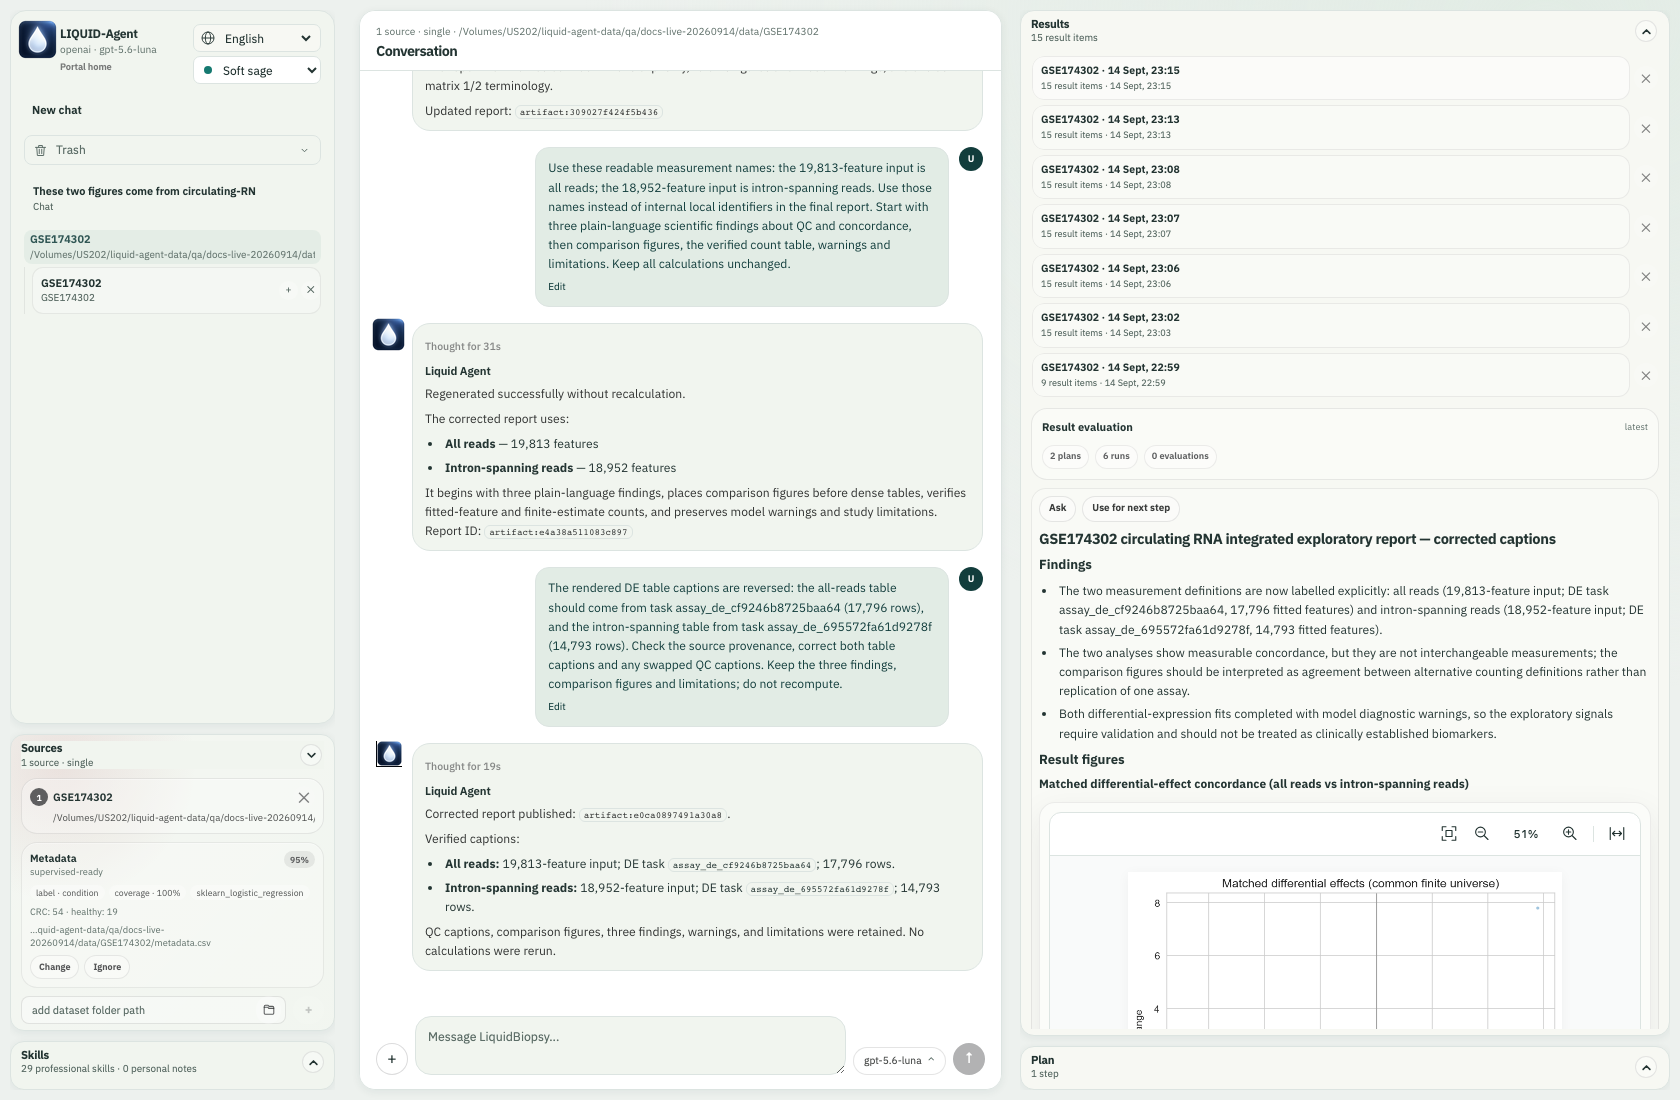
The revised report uses accepted guidance and retained scientific outputs.
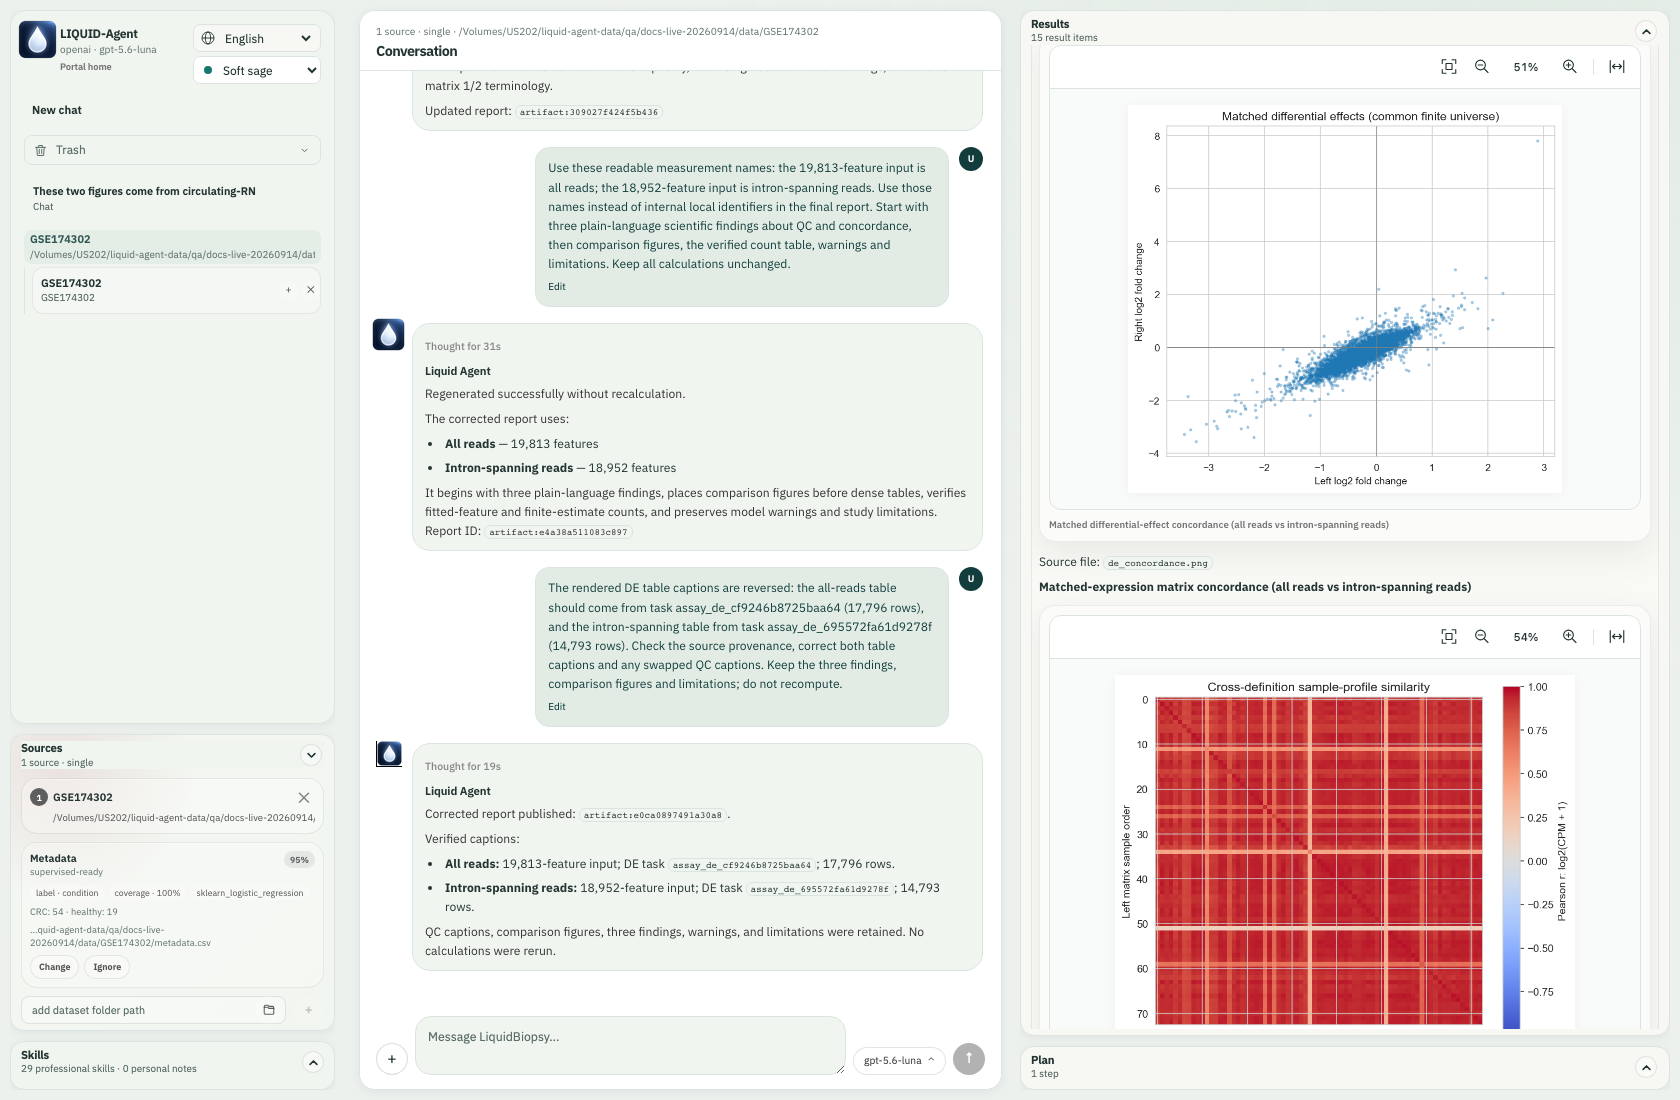
Scroll through both comparison figures before reviewing the numerical tables.
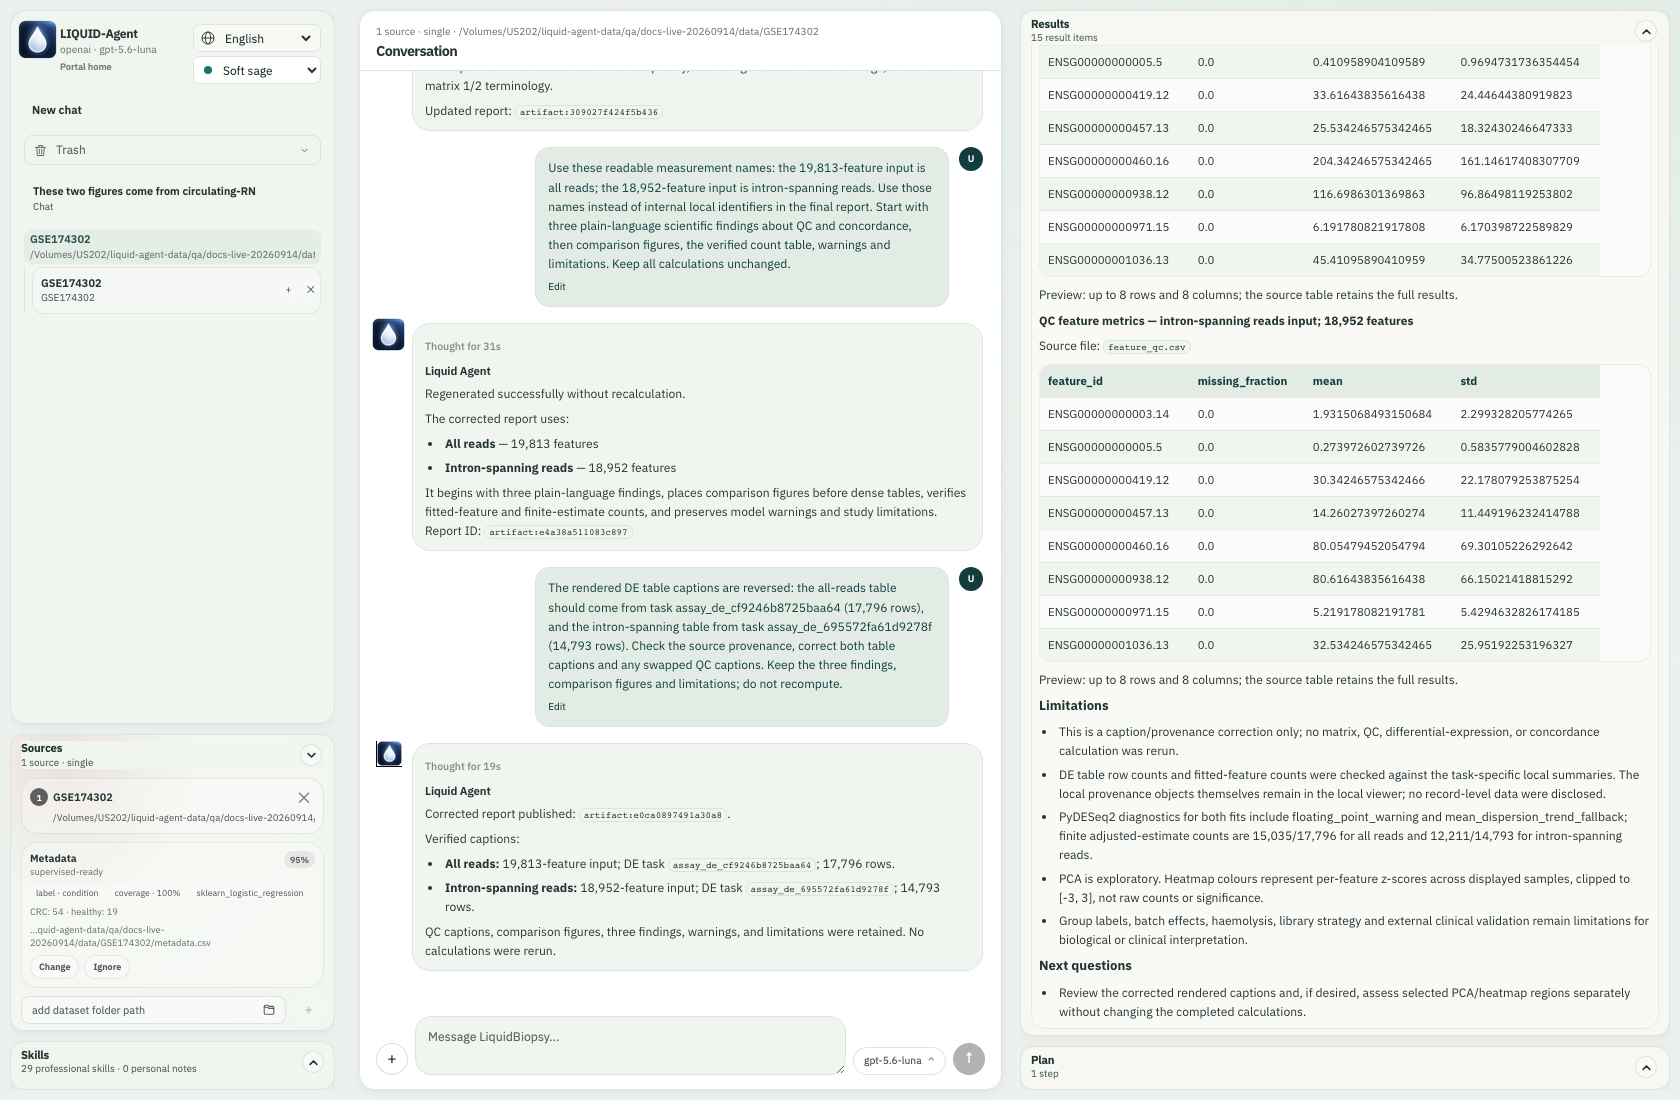
Finish at limitations and next questions; the model warnings remain visible.
This run found mean matched-expression Pearson/Spearman correlations of 0.937/0.923, differential-effect Pearson correlation 0.885, and 288 overlapping significant features (Jaccard 0.389). These are agreement measures from the same cohort, not independent validation. Both fits emitted numerical/dispersion-model diagnostics. The exploratory design does not adjust for unprovided age, sex or batch covariates and does not establish a diagnostic test.
9. Ask with uploaded images, even without attaching a dataset
In a separate New chat → Later conversation, we used + to upload the actual PCA and heatmap PNG files and asked:
These two figures come from circulating-RNA QC. I am new to this: what is the difference between the PCA scatter plot and the feature heatmap? Does either prove that cancer can be diagnosed? Explain the colour scale and what information is still missing.
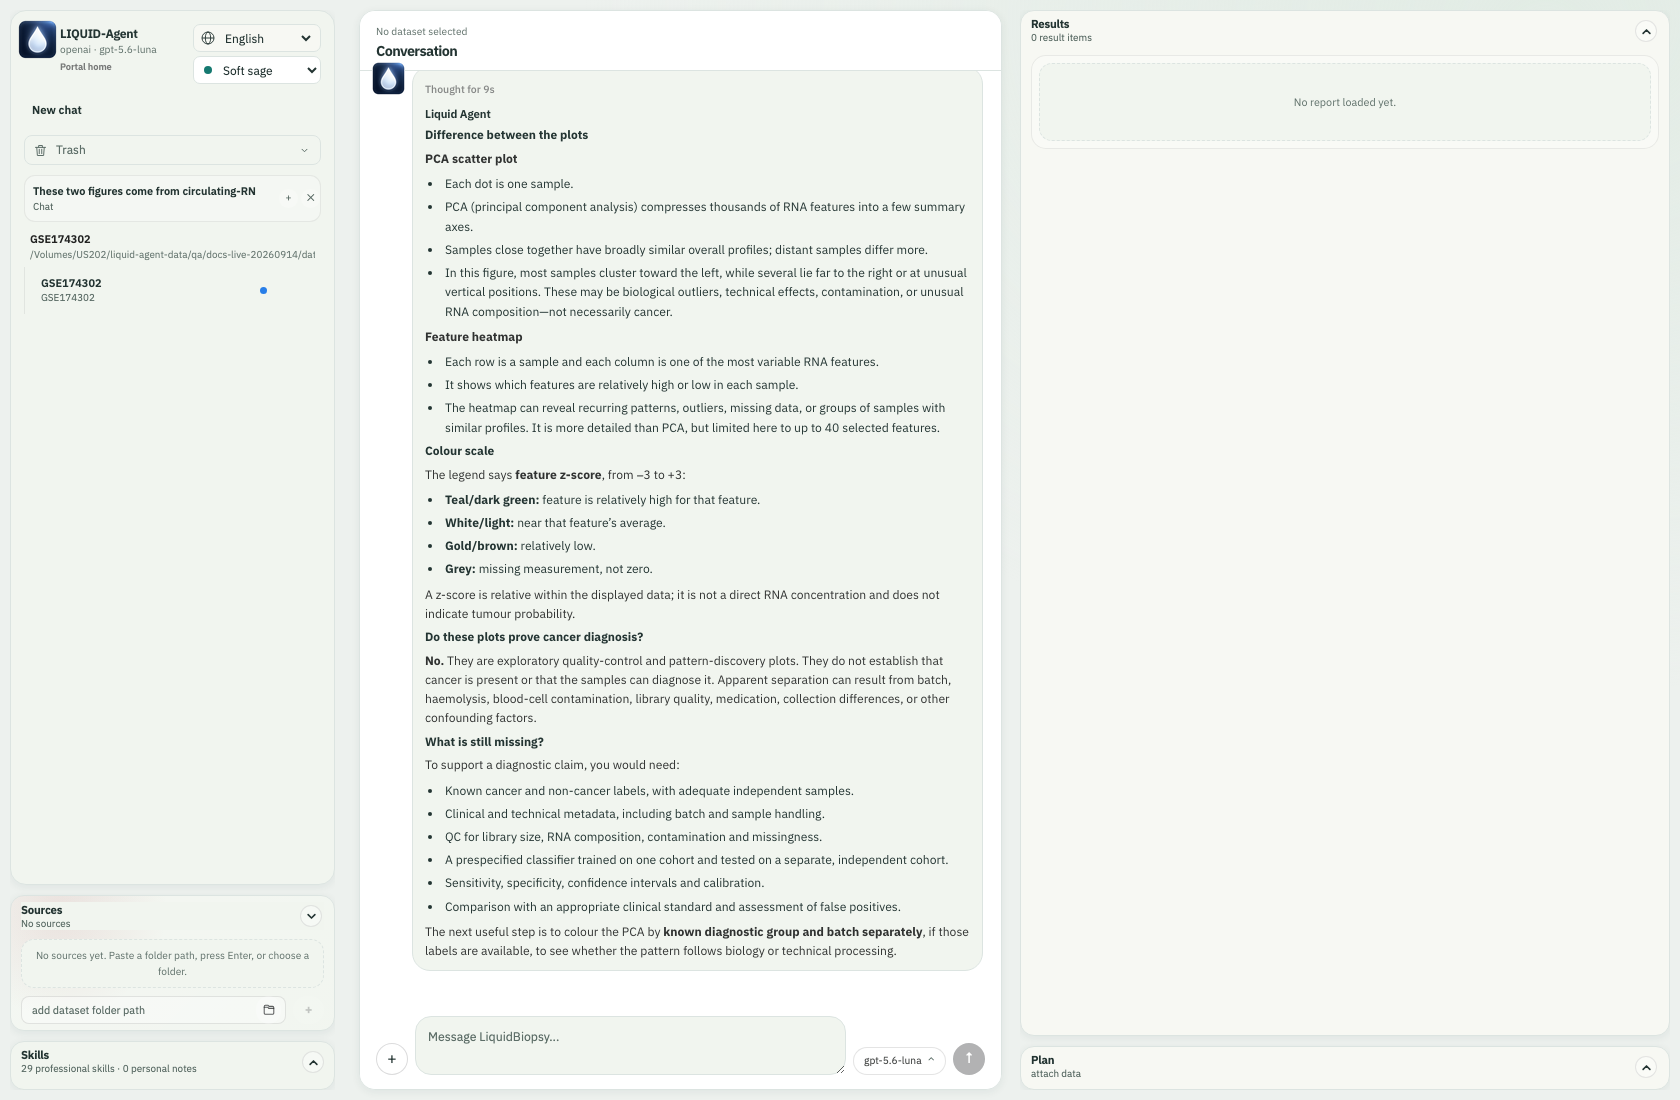
The image-only conversation receives a real multimodal answer; the completed study has an unread blue dot in the sidebar.
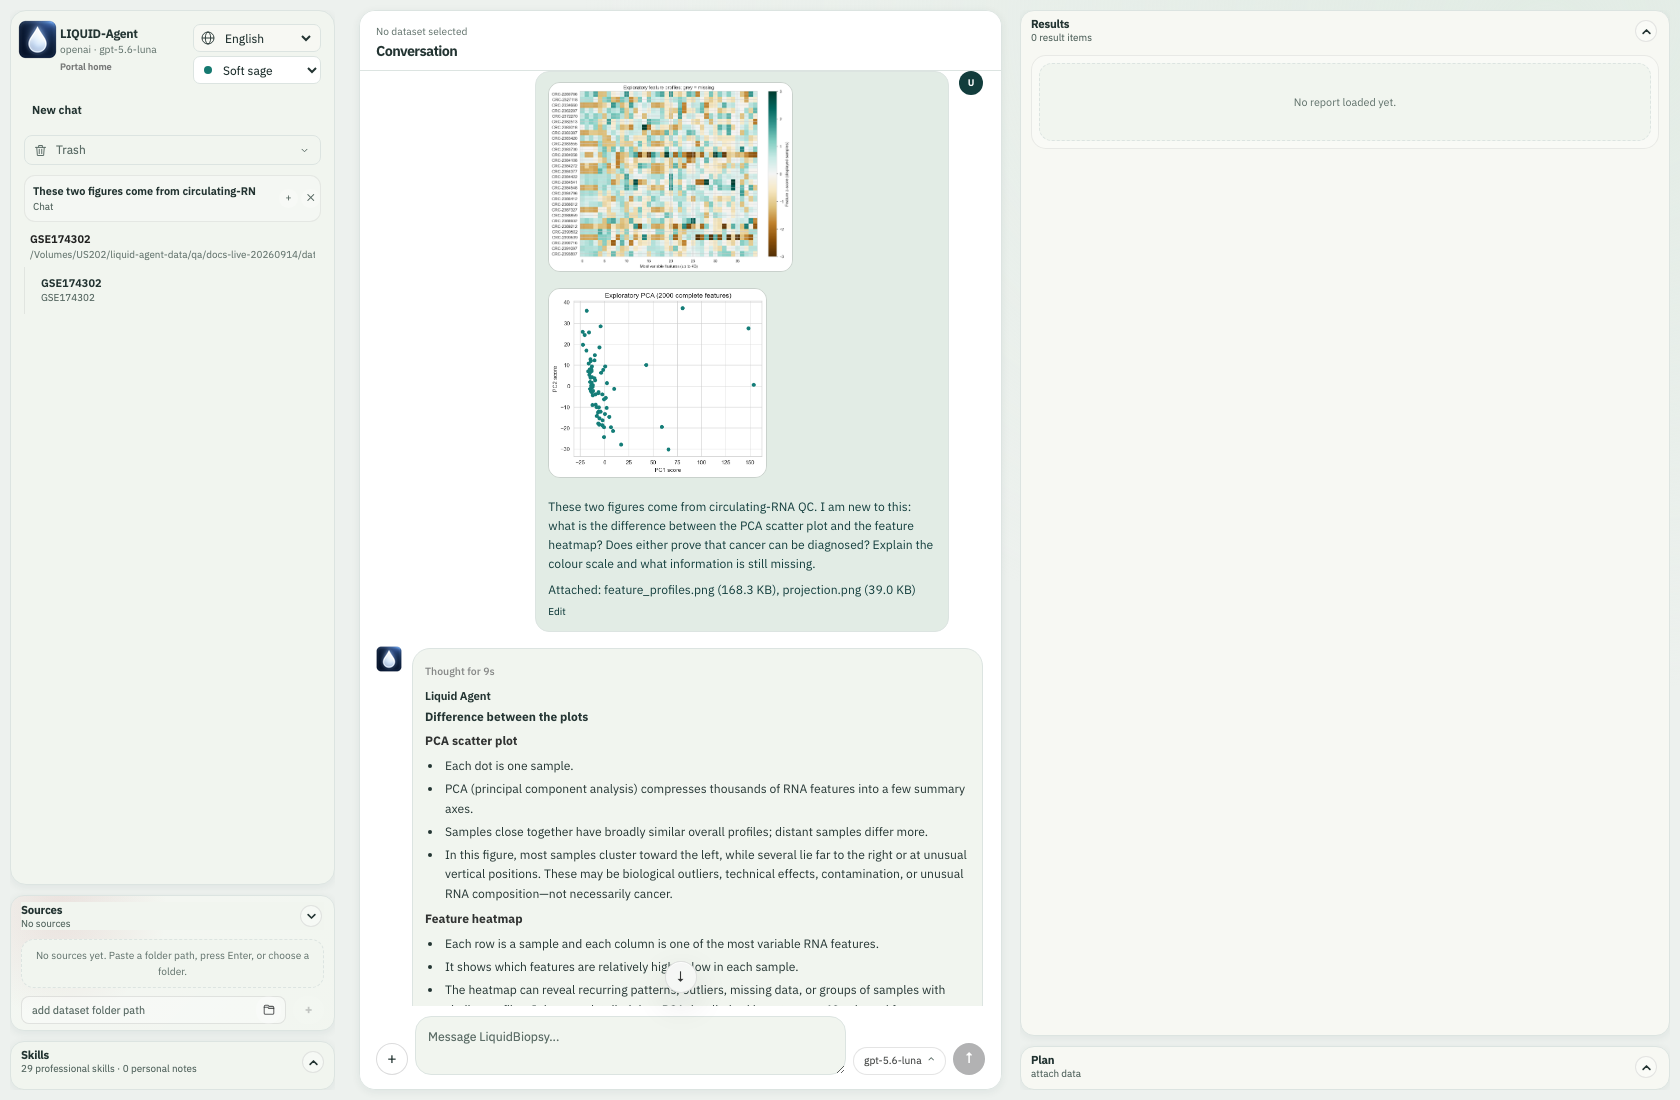
Both uploaded figures and the question are visible together in the conversation.
The answer explained samples versus features, the −3 to +3 relative colour scale and the lack of diagnostic evidence. This separate chat had no attached matrix or region provenance. Uploading a PNG is suitable for visual questions; it does not recreate the source mapping of a Results selection.
10. Recover, restore and find the next example
Images and answers remain in their conversation after reload. Trash moves a task and its owned outputs/uploads out of the active list; Restore returns that task. Original input datasets remain separate. Permanent deletion is a different, irreversible action. The screenshots below show the isolated image conversation moved to Trash and restored, not deletion of the study inputs.
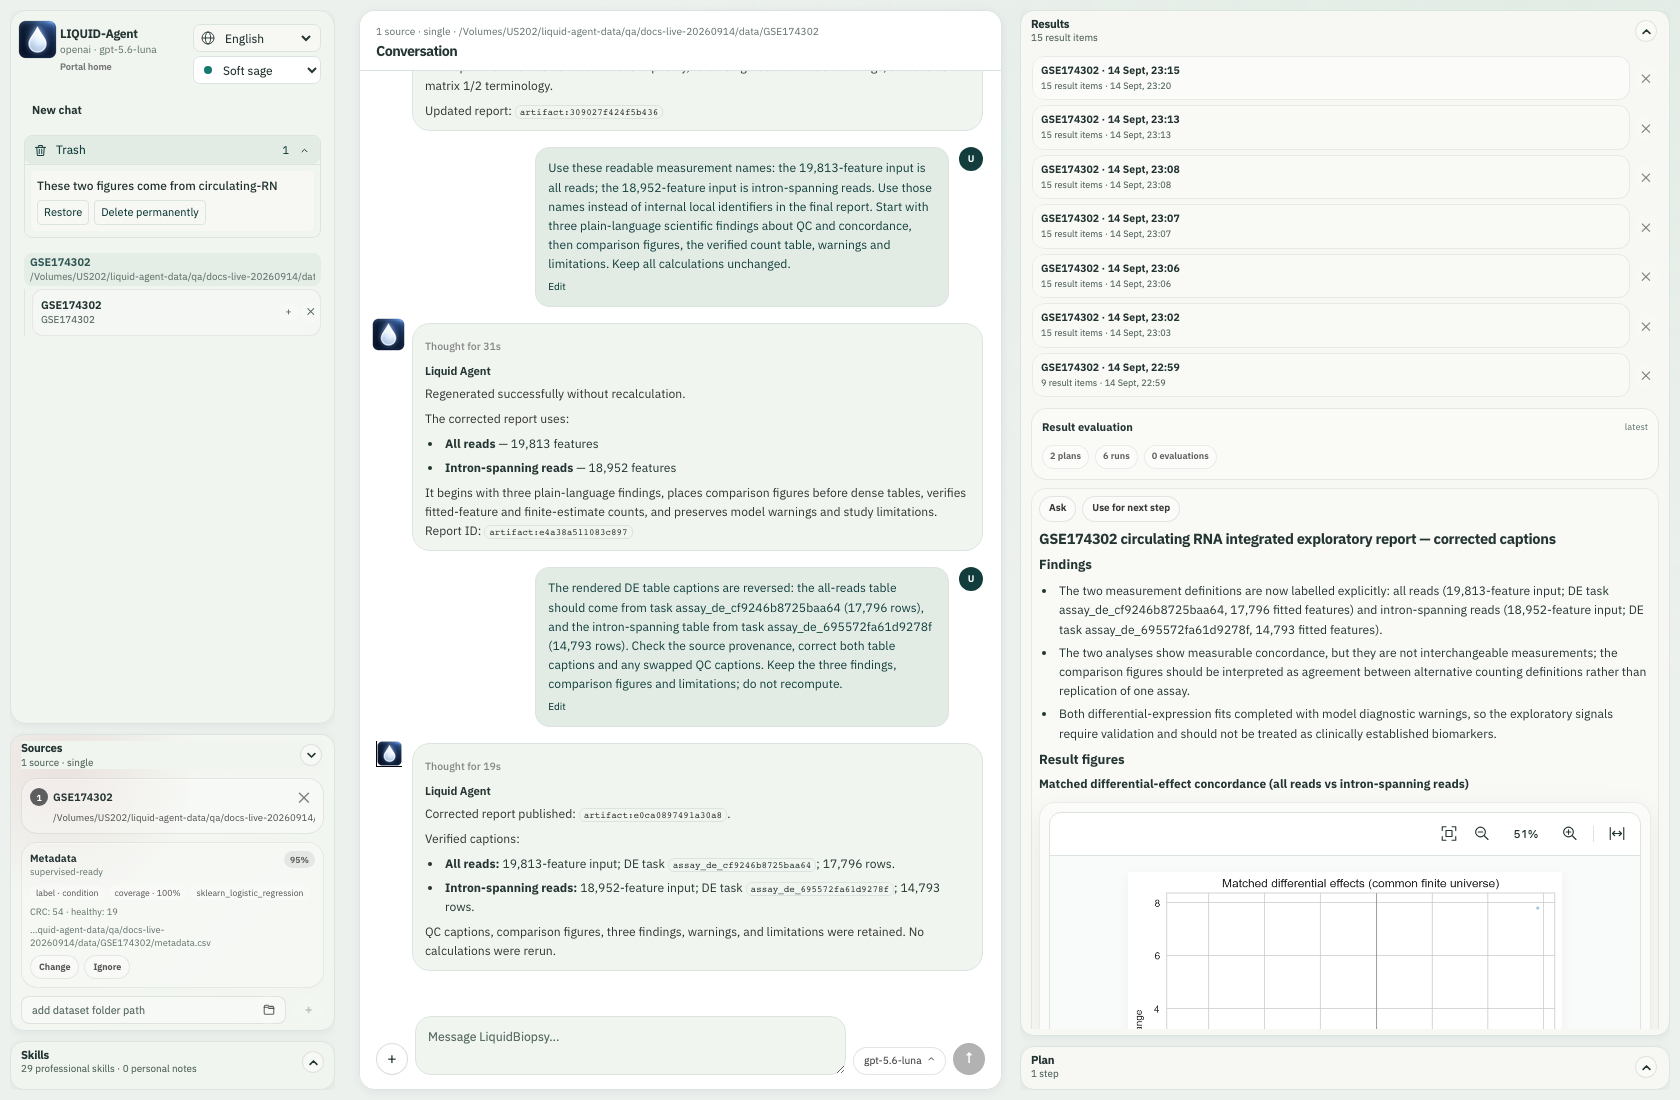
The isolated image conversation in Trash, with its Restore action. For Stop, Guide, missing-disk handling and service-restart recovery, consult runtime controls.
Use scenario prompts to adapt this workflow to a different question. This study is an example; assess suitability for your own assay and research question.